


 Abstract
 HTML
HTML Reference
 Related
 PDF
PDF


-
Quantum Chromodynamics (QCD) predicts that the interaction between quarks, which is strong at large separations, weakens as the quarks move closer to one another [1, 2]. At sufficiently high temperatures or densities, a new deconfined phase of matter, quark gluon palasma (QGP), is hypothesized and expected [3, 4].
Lattice QCD calculations predict a crossover from hadrons to QGP at zero net-baryon chemical potential (
$ \mu_B $ ) [5, 6]. However, owing to the sign problem, the phase diagram at finite$ \mu_B $ from first principles remains unknown. Some QCD-based models suggest a first-order phase transition at high$ \mu_B $ [7−9]. If this is true, with the decrease in$ \mu_B $ , the first-order phase transition line should terminate at a second-order critical point [7, 10].One of the main goals of current relativistic heavy-ion collision experiments is to reveal the phase diagram of QCD, in which the location of the critical point is the most important [11]. The correlation length extends to infinity and the susceptibilities diverge at the critical point, which results in the non-monotonic behavior of fluctuation measures. The related observables, high-order cumulants of the net-baryon number, which scale with the higher powers of the correlation length [12, 13], are a focal point for both experimental and theoretical investigations.
In experiments, because neutrons are uncharged, fluctuations in the net-baryon number are difficult to measure. The alternative observables, cumulants of the net-proton number, which are considered to have similar critical behavior, have been calculated up to the sixth-order [14, 15].
In the theory, a possible method is to extend the lattice results to finite
$ \mu_B $ using Taylor expansions [16−18] or analytical continuation from imaginary chemical potentials [19, 20]. The high-order cumulants of the net-baryon number have been calculated and extrapolated to small values of$ \mu_B $ in Refs. [21−23], but with some numerical uncertainties. An alternative method for investigating the critical behavior of high-order cumulants is QCD effective models or theories [24−27]. The other approach is based on the universality of critical behavior in phase transitions [13, 28].If the QCD critical point exists, it should be in the same universality class as the three-dimensional Ising model [29−32]. The Ising variables, reduced temperature (t) and magnetic field (h), can be mapped onto the QCD temperature and net-baryon chemical potential (
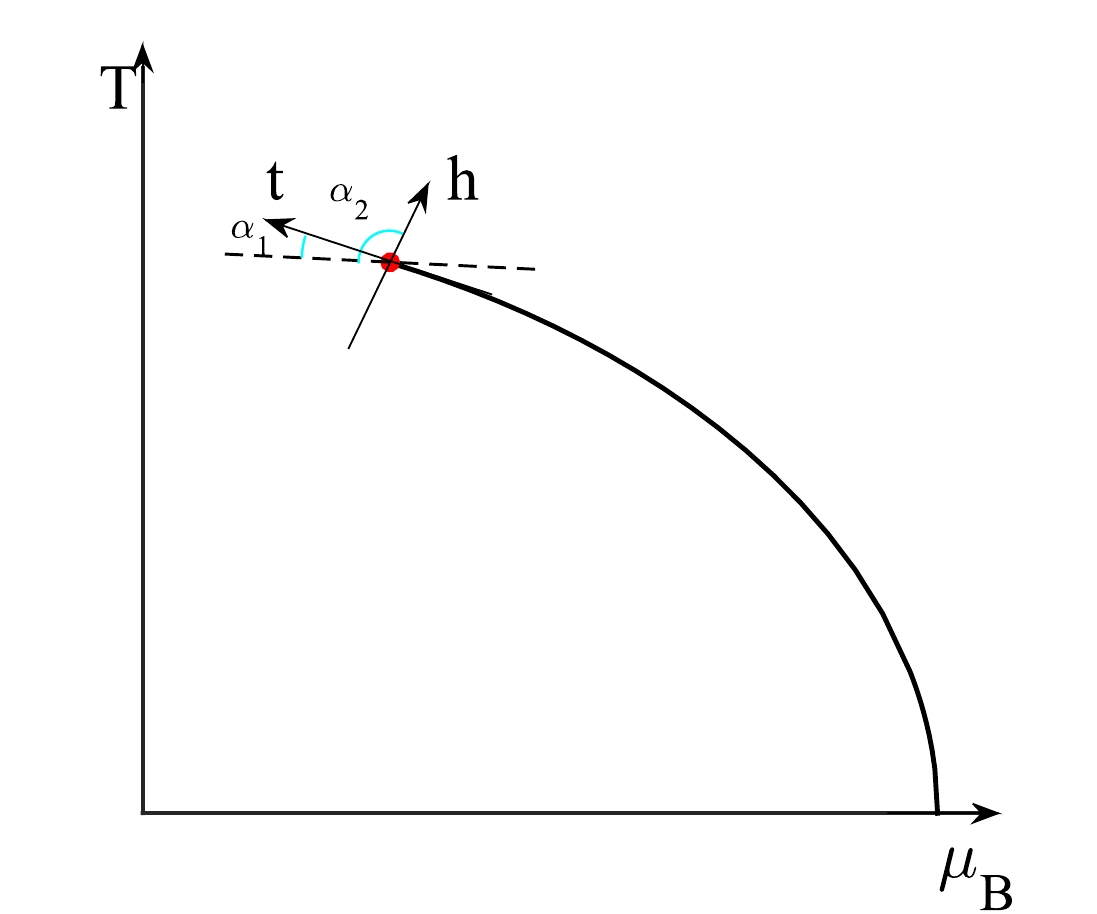
$ T-\mu_B $ ) phase plane to investigate the critical features of QCD [33−35]. The t axis is tangential to the QCD first-order phase transition line at the critical point. Generally, the h axis will deform when mapped onto the QCD$ T-\mu_B $ plane. However, how this occurs remains unclear. The common assumption in existing literature is that the h axis is orthogonal to the t axis [33, 36].A sketch of mapping the Ising variables onto the QCD
$ T-\mu_B $ phase plane is shown in Fig. 1. The solid black line represents the QCD first-order phase transition line. The red point is the QCD critical point.$ \alpha_1 $ and$ \alpha_2 $ represent the angles between the horizontal axis (where T is a constant) and t and h axes in the Ising model when they are mapped onto the QCD$ T-\mu_B $ phase plane, respectively.
Figure 1. (color online) Sketch of mapping the Ising temperature t and magnetic field h onto the QCD
$T-\mu_B $ phase plane. The red point represents the QCD critical point at the end of the first-order phase transition line.When considering the critical behavior of cumulants of the net-baryon number, typically only the leading critical contribution from the Ising model has been considered [13, 37]. When the critical point is approached along the h and t axes, the baryon-baryon correlation length diverges with the exponents
$ y_h $ and$ y_t $ , respectively [38].$ y_h\approx2.5 $ is larger than$ y_t\approx1.6 $ [39]. Therefore, the cumulants of magnetization (order parameter in the Ising model) should dominate the critical behavior of cumulants of the net-baryon number.In particular, based on this, scholars have predicted that as the critical point is approached from the crossover side, the fourth-order cumulant of the net-baryon number has a negative dip [13]. The negative dip has been considered a critical signal and used to locate the QCD critical point in experiments [40].
However, the sub-leading critical contribution can significantly affect the
$ \mu_B $ dependence of the cumulants of the net-baryon number along the freeze-out curve; even the negative dip in the fourth-order cumulant disappears when$ \alpha_2-\alpha_1=90^\circ $ [28].In our earlier paper, the negative dip in the sixth-order cumulant of the magnetization in the three-dimensional Ising model is predicted when the critical point is approached from the crossover side [41]. An interesting endeavor is to map the results of the high-order cumulants in the Ising model to QCD and study the influence of the sub-leading singular contribution.
Moreover, recent lattice results predict that the QCD critical temperature is lower than
$ 135 $ MeV [42, 43]. The functional renormalization group and Dyson-Schwinger equation approaches have shown that the transition from hadronic phase to QGP is a crossover with increasing$ \mu_B $ for$ \mu_B/T \lesssim 4 $ [44−48]. A QCD critical point is found at larger$ \mu_B $ values, although this is beyond the quantitative reliability of the theory computations [46−48]. Therefore, the behavior of high-order cumulants of the net-baryon number at large$ \mu_B $ values for$ \mu_B/T > 4 $ should be studied.In this paper, we assume the equilibrium of the QCD system and the existence of QCD critical point at
$ (T_C,\mu_{BC})=(107,635) $ MeV [46], where$ T_C $ and$ \mu_{BC} $ are the temperature and net-baryon chemical potential at the QCD critical point, respectively. Through mapping the results from the three-dimensional Ising model to that of QCD, we study the critical behavior of the sixth-, eighth-, and tenth-order susceptibilities of the net-baryon number. They have similar behavior with the corresponding cumulants. The leading and sub-leading critical contribution from the Ising model is discussed.The remainder of this paper is organized as follows. In section II, the parametric representation of the three-dimensional Ising model is introduced. Furthermore, the linear mapping from this model to QCD is presented, and the expression of generalized susceptibilities of net-baryon number is deduced. In section III, the effects of leading singular contribution on the behavior of the sixth-, eighth-, and tenth-order susceptibilities of the net-baryon number is analyzed and discussed considering different values of mapping parameters. In section IV, effects of the sub-leading singular contribution on the behavior of these susceptibilities is investigated and discussed. Finally, conclusions and summary are given in section V.
-
In the parametric representation of the three-dimensional Ising model, magnetization (M) and reduced temperature (t) can be parameterized using two variables, R and θ [49, 50]:
$ \begin{aligned} M=m_0R^{\beta}\theta,\; \; \; \; \; \; t=R(1-\theta^2). \end{aligned} $

(1) The equation of state expressed by R and θ is
$ \begin{aligned} h=h_0R^{\beta\delta}\widetilde h(\theta). \end{aligned} $

(2) $ m_0\simeq0.605 $ in Eq. (1) and$ h_0\simeq0.364 $ in Eq. (2) are normalization constants. They are fixed by imposing the normalization conditions$ M(t=-1,h=+0)=1 $ and$M(t=0, h=1)=1$ .$ \beta\simeq0.326 $ and$ \delta\simeq4.8 $ are critical exponents of the three-dimensional Ising universality class [51].$ \widetilde h(\theta)=\theta(1-0.76201\theta^{2}+0.00804\theta^{4}) $ . The parameters are within the range$ R\geqslant0 $ and$ |\theta|\leqslant1.154 $ .The free energy density can be defined as [35]
$ \begin{aligned} F(M,t)=h_0m_0R^{2-\alpha}g(\theta), \end{aligned} $

(3) where
$ \alpha\simeq0.11 $ is another critical exponent of the three-dimensional Ising universality class. The relation$ 2-\alpha= \beta(\delta-1) $ holds, and$ \begin{aligned} g(\theta)=c_0+c_1(1-\theta^2)+c_2(1-\theta^2)^2+c_3(1-\theta^2)^3, \end{aligned} $

(4) with
$ \begin{aligned} \begin{split} &c_0=\frac{\beta}{2-\alpha}(1+a+b),\\ &c_1=-\frac{1}{2(\alpha-1)}[(1-2\beta)(1+a+b)-2\beta(a+2b)],\\ &c_2=-\frac{1}{2\alpha}[2\beta b-(1-2\beta)(a+2b)],\\ &c_3=-\frac{1}{2(\alpha+1)}b(1-2\beta). \nonumber \end{split} \end{aligned} $

Thus, the Gibbs free energy density is
$ \begin{aligned} G(h,t)=F(M,t)-Mh. \end{aligned} $

(5) The pressure equals the Gibbs free energy density up to a minus sign:
$ P = -G $ ; hence, the pressure in the Ising model can be expressed as follows:$ \begin{aligned} P^{\rm Ising}(R,\theta)=h_0m_0R^{2-\alpha}[\theta\widetilde h(\theta)-g(\theta)]. \end{aligned} $

(6) The
$ n_{th} $ -order susceptibility of the magnetization and energy represented by R and θ can be obtained from the derivatives of the pressure with respect to h and t,$ \begin{aligned} \chi_{n_1,n_2}^{M,E}=\frac{\partial^{n_1+n_2}P^{Ising}}{\partial h^{n_1}\partial t^{n_2}},\;\; n=n_1+n_2. \end{aligned} $

(7) When
$ n_2=0 $ , it is the$ n_{th} $ -order susceptibility ($ \chi_{n}^{M} $ ) of the magnetization. When$ n_1=0 $ , it is the$ n_{th} $ -order susceptibility ($ \chi_{n}^{E} $ ) of the energy.For example,
$ \chi_1^{M} = \left(\frac{\partial P^{\rm Ising}}{\partial h} \right)_t=\frac{\partial P^{\rm Ising}}{\partial R}\left(\frac{\partial R}{\partial h} \right)_t+\frac{\partial P^{\rm Ising}}{\partial \theta}\left(\frac{\partial \theta}{\partial h}\right)_t, $

(8) $ \chi_1^{E} = \left(\frac{\partial P^{\rm Ising}}{\partial t} \right)_h =\frac{\partial P^{\rm Ising}}{\partial R}\left(\frac{\partial R}{\partial t} \right)_h+\frac{\partial P^{\rm Ising}}{\partial \theta}\left(\frac{\partial \theta}{\partial t}\right)_h. $

(9) Here,
$ \partial R /\partial h $ ,$ \partial \theta /\partial h $ ,$ \partial R /\partial t $ , and$ \partial \theta /\partial t $ can be obtained from Eqs. (1) and (2).To map the results of the Ising model to that of QCD, we can express a linear relationship [28, 35, 52] including six mapping parameters as follows:
$ \begin{aligned} \frac{T-T_C}{T_C}=w(\rho t\sin\alpha_1+h\sin\alpha_2), \end{aligned} $

(10) $ \begin{aligned} \frac{\mu_B-\mu_{BC}}{T_C}=w(-\rho t\cos\alpha_1-h\cos\alpha_2), \end{aligned} $

(11) where w and ρ are two scaling parameters of the mapping from the Ising model to QCD.
$ \alpha_1 $ and$ \alpha_2 $ are two angles that have been introduced in Section I.To reduce the number of mapping parameters, we express the QCD phase transition line up to
$ O(\mu_B^4) $ as follows:$ \begin{aligned} T= T_0\left[1-\kappa\left(\frac{\mu_B}{T_0}\right)^2-\lambda \left(\frac{\mu_B}{T_0}\right)^4\right], \end{aligned} $

(12) where
$ T_0 $ is the transition temperature at$ \mu_B=0 $ , which is set as$ 156.5 $ MeV based on the lattice results in Ref. [53]. κ is the curvature at$ \mu_B=0 $ , which is set as$ 0.015 $ . Recent results from the functional renormalization group and Dyson-Schwinger equations approaches [46−48] and lattice QCD [53−55] agree within an error of$ \kappa \approx 0.015 $ . Based on the results in Refs. [44−48], the transition from the hadronic phase to QGP is a crossover with increasing$ \mu_B $ for$ \mu_B/T \lesssim 4 $ . The QCD critical point might exist beyond this region [44−48]. In this paper, we adopt the critical point$ (T_C,\mu_{BC})=(107,635) $ MeV in Ref. [46]. To allow the QCD phase transition line through the critical point, we set λ as$ 0.000256 $ . This value agrees with the lattice results within the errors in Refs. [53, 55].Because the t axis in the Ising model is tangential to the first-order phase transition line at the QCD critical point, the value of
$ \alpha_1 $ can be fixed at$ 10.8^{\circ} $ . For the common ''default'' choice in the literature, the h axis is orthogonal to the t axis. Therefore, we set$ \alpha_2=100.8^\circ $ in this paper. Thus, only two mapping parameters w and ρ are unknown.Generalized susceptibilities of net-baryon number (
$ \chi_n^{B} $ ) can be obtained from the nth-order derivatives of the pressure with respect to$ \mu_B $ at fixed T:$ \begin{aligned} \chi_n^{B}(T,\mu_B)=\left(\frac{\partial^{n} P/T^4}{\partial (\mu_B/T)^n}\right)_T. \end{aligned} $

(13) The full QCD pressure can be reconstructed as in Ref. [35]:
$ \begin{aligned}[b] P(T,\mu_B)=\;&T^4 \sum_{n}c_n^{\rm Non-Ising}(T)\left(\frac{\mu_B}{T}\right)^n \\ & +P_C^{QCD}(T,\mu_B),\end{aligned} $

(14) where the first term on the left side is the Taylor expansion of the pressure from the "Non-Ising" contribution.
$c_n^{\rm Non-Ising}(T)$ is the corresponding Taylor expansion coefficient.$P_C^{\rm QCD}(T,\mu_B)$ represents the critical pressure mapped from the three-dimensional Ising model onto QCD. The details are available in Refs. [28, 35].In this paper, we consider only the critical point contribution to the behavior of the sixth-, eighth-, and tenth-order susceptibilities of the net-baryon number. The pressure in Eq. (13) can be expressed as follows [35]:
$ \begin{aligned} P(T,\mu_B)=T_C^4P^{Ising}(R(T,\mu_B),\theta(T,\mu_B)). \end{aligned} $

(15) The
$ 2n $ th-order susceptibility of net-baryon number can be expressed as$ \chi_{2n}^B=T_C^4T^{2n-4} \sum_{k=0}^{2n} C(2n,k) \left(\frac{\partial h}{\partial \mu_B}\right)^{2n-k} \left(\frac{\partial t}{\partial \mu_B}\right)^{k}\chi_{2n-k,k}^{M,E}, $

(16) where
$ C(2n,k)=(2n)!/k!/(2n-k)! $ .$ \partial h /\partial \mu_B $ and$ \partial t /\partial \mu_B $ can be obtained from Eq. (11):$ \begin{aligned} & \partial h /\partial \mu_B=-\sin(\alpha_1)/[T_c w \sin(\alpha_1 - \alpha_2)], \\ & \partial t /\partial \mu_B=\sin(\alpha_2)/[T_c w \rho \sin(\alpha_1 - \alpha_2)]. \end{aligned} $

(17) When only the leading singular contribution is considered, i.e., k takes the value
$ 0 $ in Eq. (16), and the corresponding$ 2n $ th-order susceptibility of net-baryon number is$ \begin{aligned} \chi_{2n}^{B,L}=T_C^4T^{2n-4}\left(\frac{\partial h}{\partial \mu_B}\right)^{2n}\chi_{2n}^{M}. \end{aligned} $

(18) -
When considering only the leading critical contribution of the mapping from the Ising model to QCD, density plots of the sixth-, eighth-, and tenth-order susceptibilities of the net-baryon number are shown in the left, middle, and right columns of Fig. 2, respectively. The values of mapping parameters are the same for each row. That is,
$ w=0.4 $ ,$ \rho=0.8 $ for the top row,$ w=0.8 $ ,$ \rho=0.8 $ for the middle row, and$ w=0.8 $ ,$ \rho=0.4 $ for the bottom row.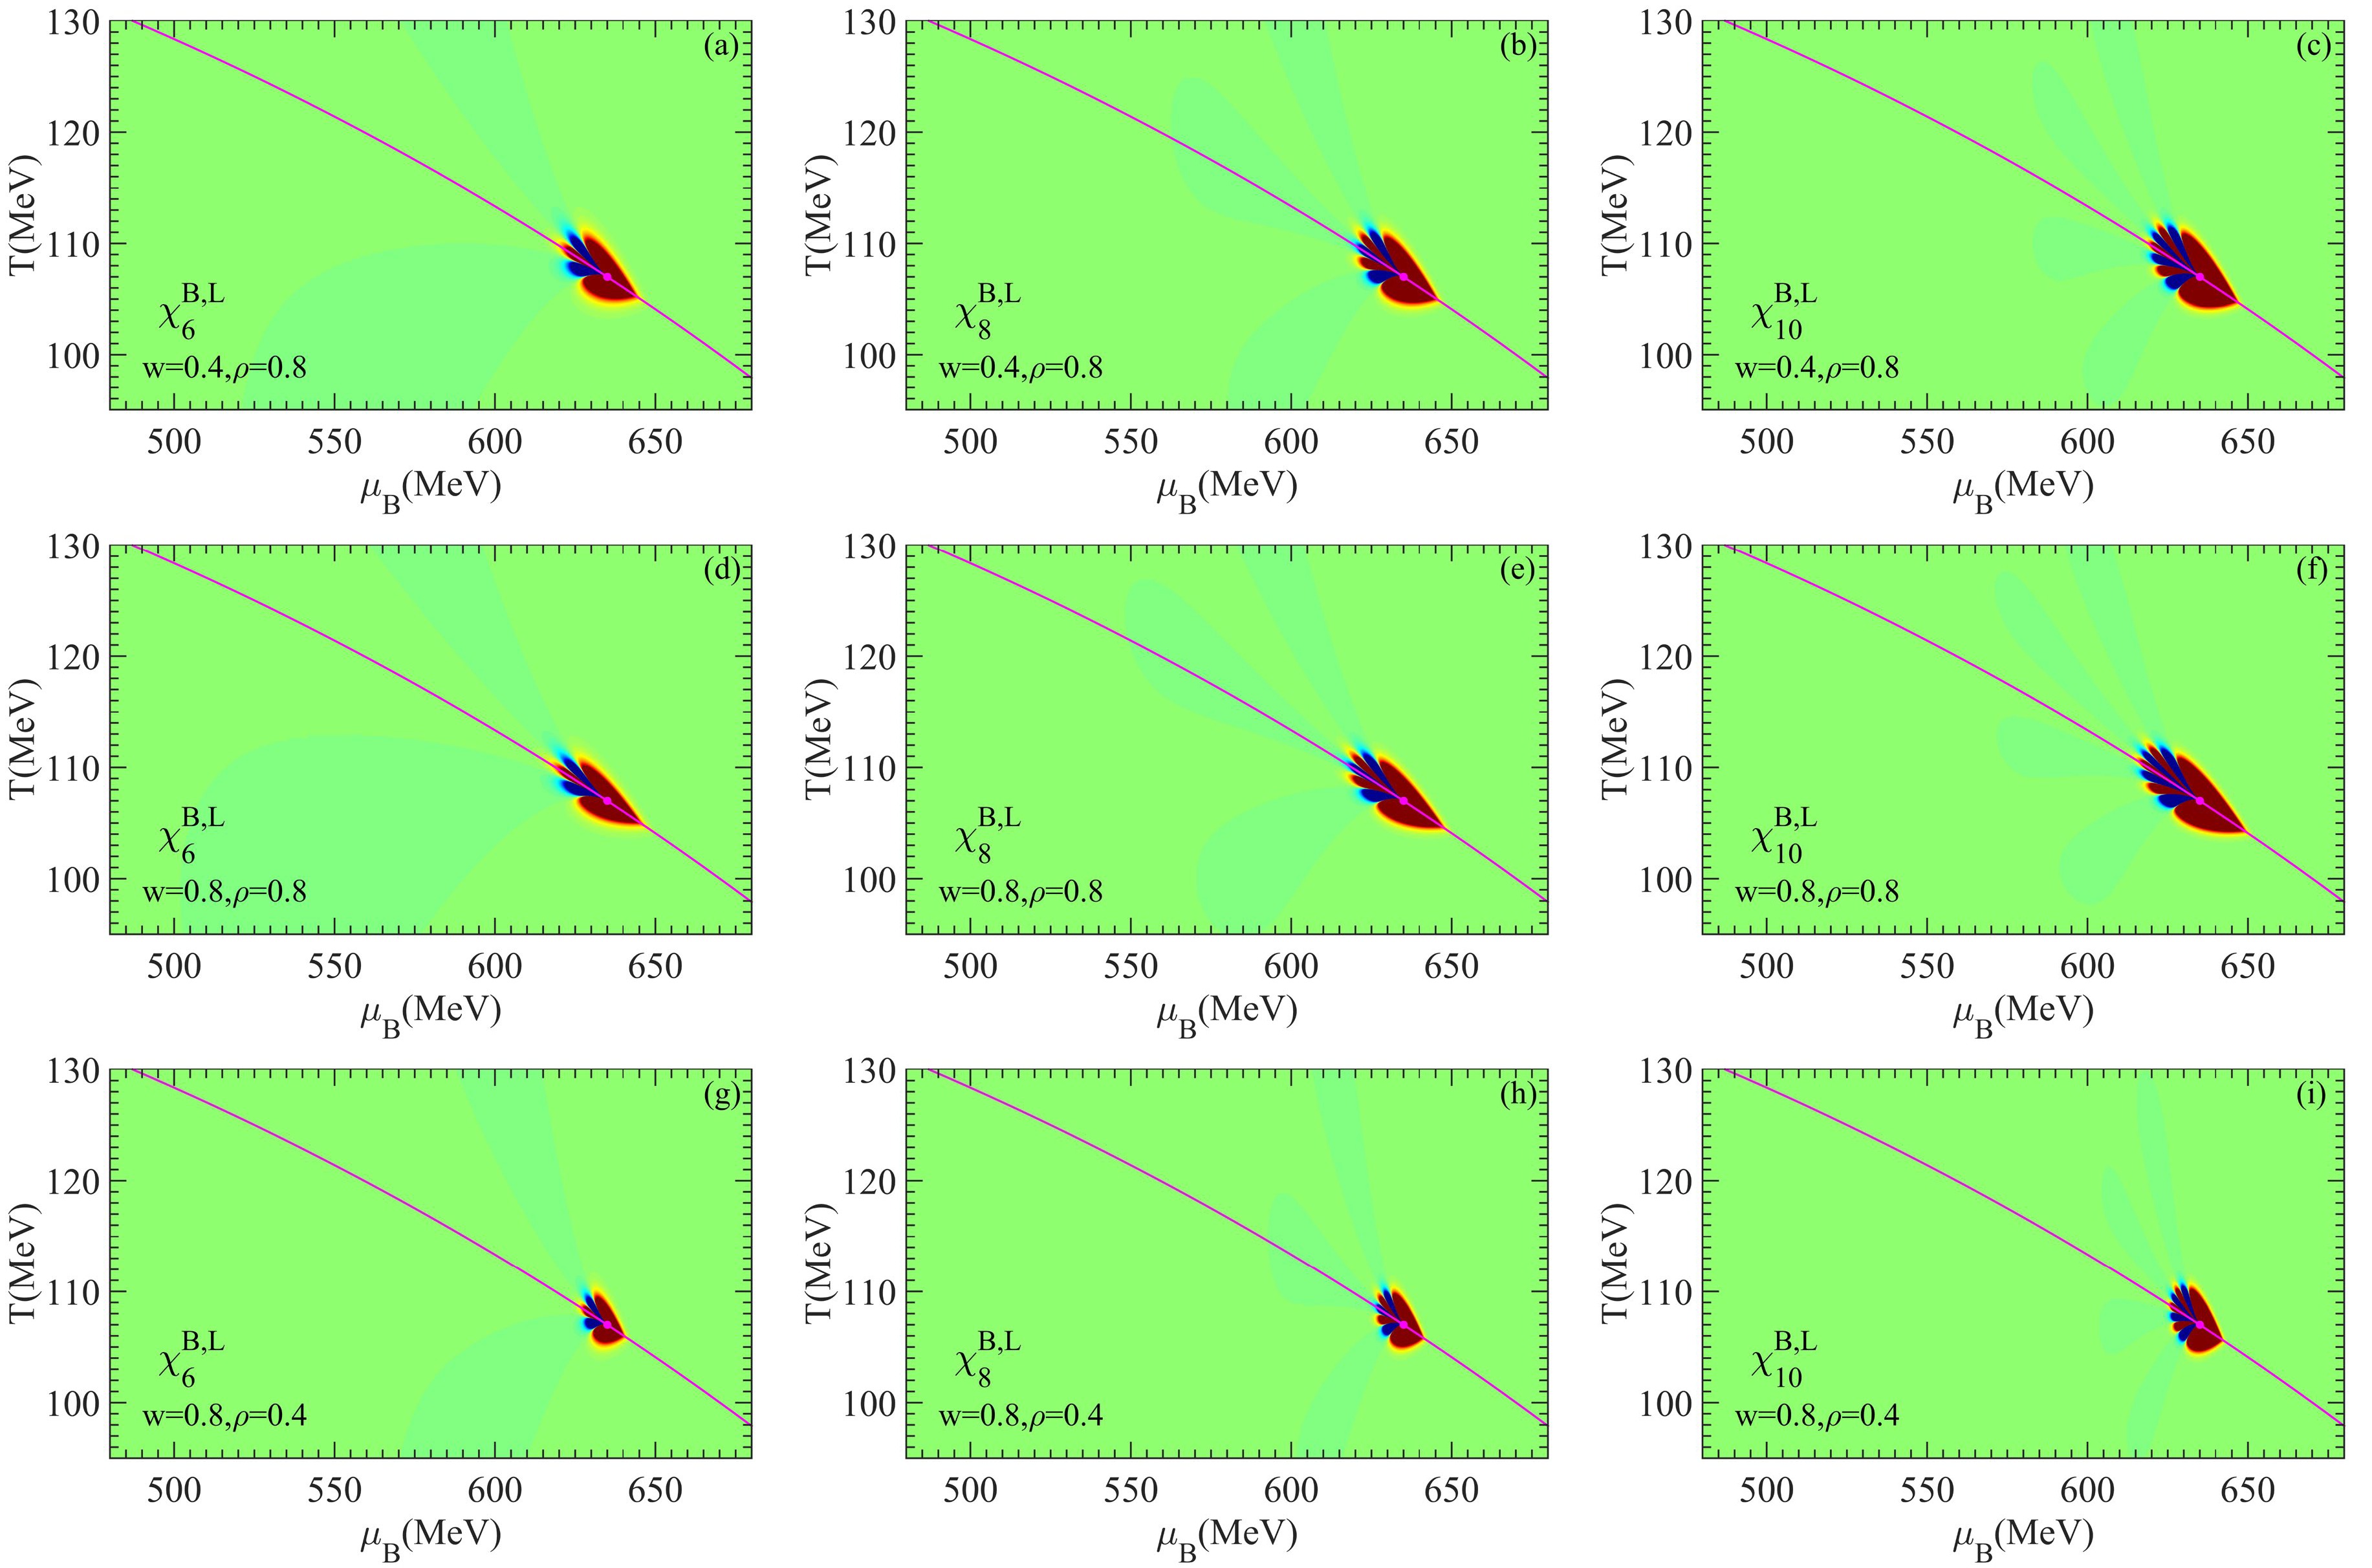
Figure 2. (color online) Density plots of the critical contribution to
$ \chi_{6}^{B,L} $ ,$ \chi_{8}^{B,L} $ , and$ \chi_{10}^{B,L} $ in the QCD$ T-\mu_B $ phase plane with$ w=0.4, \rho=0.8 $ (top row),$ w=0.8, \rho=0.8 $ (middle row), and$ w=0.8, \rho=0.4 $ (bottom row). The critical point is indicated by a purple dot, whereas the chiral phase transition line is represented by the solid purple line. The green, yellow, and red areas correspond to positive values (the regions with the largest and smallest values are indicated in red and green, respectively) of the susceptibilities, whereas the blue ones correspond to negative values (the darker the blue, the larger the magnitude of the susceptibilities).The color function of the three columns of Fig. 2 is different because of the singificant differences in the magnitude of different orders of susceptibilities. The color schemes are such that, for the same color, a factor of one thousand in the value of
$ \chi_8^{B,L} $ and one million in the value of$ \chi_{10}^{B,L} $ separates the middle and right columns with the left column.In each sub-figure, the green, yellow, and red areas correspond to positive values. The regions with the largest and smallest values are indicated in red and green, respectively. The blue areas correspond to negative values, and the darker the color, the larger the magnitude. The purple curve shows the QCD phase transition line represented by Eq. (12). The purple dot marks the critical point.
In the left column of Fig. 2, we observe that the general patterns in density plots of
$ \chi_6^{B,L} $ do not change with varying values of w and ρ. Those of$ \chi_8^{B,L} $ and$ \chi_{10}^{B,L} $ in the middle and right columns. As the value of$ \mu_B $ s increases, the density plot of$ \chi_{6}^{B,L} $ ,$ \chi_{8}^{B,L} $ , and$ \chi_{10}^{B,L} $ exhibit alternating negative and positive lobes. The higher the order of susceptibility, the more frequent this alternation becomes, leading to a greater number of sign changes in the susceptibilities.Comparing each row of Fig. 2, we observe that the main pattern around the critical point is wider in the T direction in the top row than the other rows, where
$ w=0.4 $ is smaller in the top row than$ w=0.8 $ in the other two rows. In contrast, in the$ \mu_B $ direction, the main pattern around the critical point is narrower in the bottom row with$ \rho=0.4 $ than the upper rows where$ \rho=0.8 $ . These effects of w and ρ are consistent with the results with Ref. [28]. A smaller w leads to wider critical region in the T direction, whereas a smaller ρ leads to a narrower critical region in the$ \mu_B $ direction.To investigate the
$ \mu_B $ dependence of the net-baryon number susceptibilities and its significance in measuring the energy dependence of net-proton in experiments, we assume a freeze-out curve that approximately parallels the QCD phase transition line as described by Eq. (12), but it is shifted towards lower temperatures by$ \Delta T $ , that is$ \begin{aligned} T_f(\mu_B)=T_0\left[1-\kappa\left(\frac{\mu_B}{T_0}\right)^2-\lambda \left(\frac{\mu_B}{T_0}\right)^4\right]-\Delta T. \end{aligned} $

(19) The
$ \mu_B $ dependences of$ \chi_{6}^{B,L} $ ,$ \chi_{8}^{B,L} $ , and$ \chi_{10}^{B,L} $ along the freeze-out curve described by Eq. (19) with$ \Delta T = 1.0 $ MeV are shown in Fig. 3(a), 3(b), and 3(c), respectively. The red, purple, black, cyan, and blue curves are for five different combinations of values of$ w= $ 0.4, 0.8, 1.6 and$ \rho= $ 0.4, 0.8, 1.6. The green horizontal and vertical dashed lines show the zero values of the susceptibilities and the net-baryon chemical potential$ \mu_{BC}=635 $ MeV at the QCD critical point, respectively.
Figure 3. (color online)
$ \mu_B $ dependences of$ \chi_{6}^{B,L} $ (a),$ \chi_{8}^{B,L} $ (b), and$ \chi_{10}^{B,L} $ (c) at$ \Delta T=1.0 $ MeV with different values of w and ρ.We observe that the
$ \mu_B $ dependence of$ \chi_{6}^{B,L} $ in Fig. 3(a) has a negative dip followed by a positive peak when the critical point is approached from the crossover side. Similar reults are observed for$ \chi_{8}^{B,L} $ in Fig. 3(b) and$ \chi_{10}^{B,L} $ in Fig. 3(c). Different values of w and ρ do not change the generic structure of the$ \mu_B $ dependence of$ \chi_{6}^{B,L} $ ,$ \chi_{8}^{B,L} $ , and$ \chi_{10}^{B,L} $ .In each sub-figure, the peak in the red curve is the highest, the peak in the blue curve is the lowest, and the peaks in the purple, black, and cyan curves are of approximately equal height. This observation indicates that as the value of w decreases, the peak height in the
$ \mu_B $ dependence of$ \chi_{6}^{B,L} $ ,$ \chi_{8}^{B,L} $ , and$ \chi_{10}^{B,L} $ increases along the freeze-out curve, whereas the influence of ρ on the peak height is small. However, the peak width expands with increasing values of ρ. These findings correspond with the anticipated effects of w and ρ in the critical region.As the order of the susceptibilities increases, the height of the peak and depth of the dip both intensify, whereas their respective widths diminish. Furthermore, the negative dip becomes more pronounced, with the ratio of the depth of the negative dip to the height of the peak increasing. For instance, this ratio is approximately
$ 0.163 $ ,$ 0.275 $ , and$ 0.361 $ for the red curves presented in Fig. 3(a), 3(b), and 3(c), respectively, indicating a trend towards a more significant contrast between the peak and dip with higher-order susceptibilities.Although the density plots of
$ \chi_6^{B,L} $ ,$ \chi_8^{B,L} $ , and$ \chi_{10}^{B,L} $ in Fig. 2 suggest that the$ \mu_B $ dependence of these susceptibilities should undergo multiple sign changes as their order increases, only the positive lobe immediately below the critical point and its nearest negative lobe lead to the prominent peak and dip in Fig. 3. The magnitudes of the values of other lobes are notably smaller than those of the two lobes closest to the critical point, making them difficult to be observed in the$ \mu_B $ dependence. -
Compared with the sub-leading critical contributions to the net-baryon number susceptibilities, i.e., the terms where
$ k \neq 0 $ in Eq. (16), the leading singular contribution will be suppressed by a power of$ \sin \alpha_1/\sin \alpha_2 $ when$ \alpha_1 $ is small but$ \alpha_2 $ is not [28]. This is exactly the case for the common choice of the mapping from Ising variables to the QCD$ T-\mu_B $ phase plane, such as$ \alpha_1=10.8^\circ $ and$ \alpha_2=100.8^\circ $ in this paper.The density plots of the critical contribution to
$ \chi_6^B $ ,$ \chi_8^B $ , and$ \chi_{10}^B $ are shown in Fig. 4, utilizing the same parameters as those employed in Fig. 2, i.e.,$ w=0.4 $ ,$ \rho=0.8 $ for the top row,$ w=0.8 $ ,$ \rho=0.8 $ for the middle row, and$ w=0.8 $ ,$ \rho=0.4 $ for the bottom row.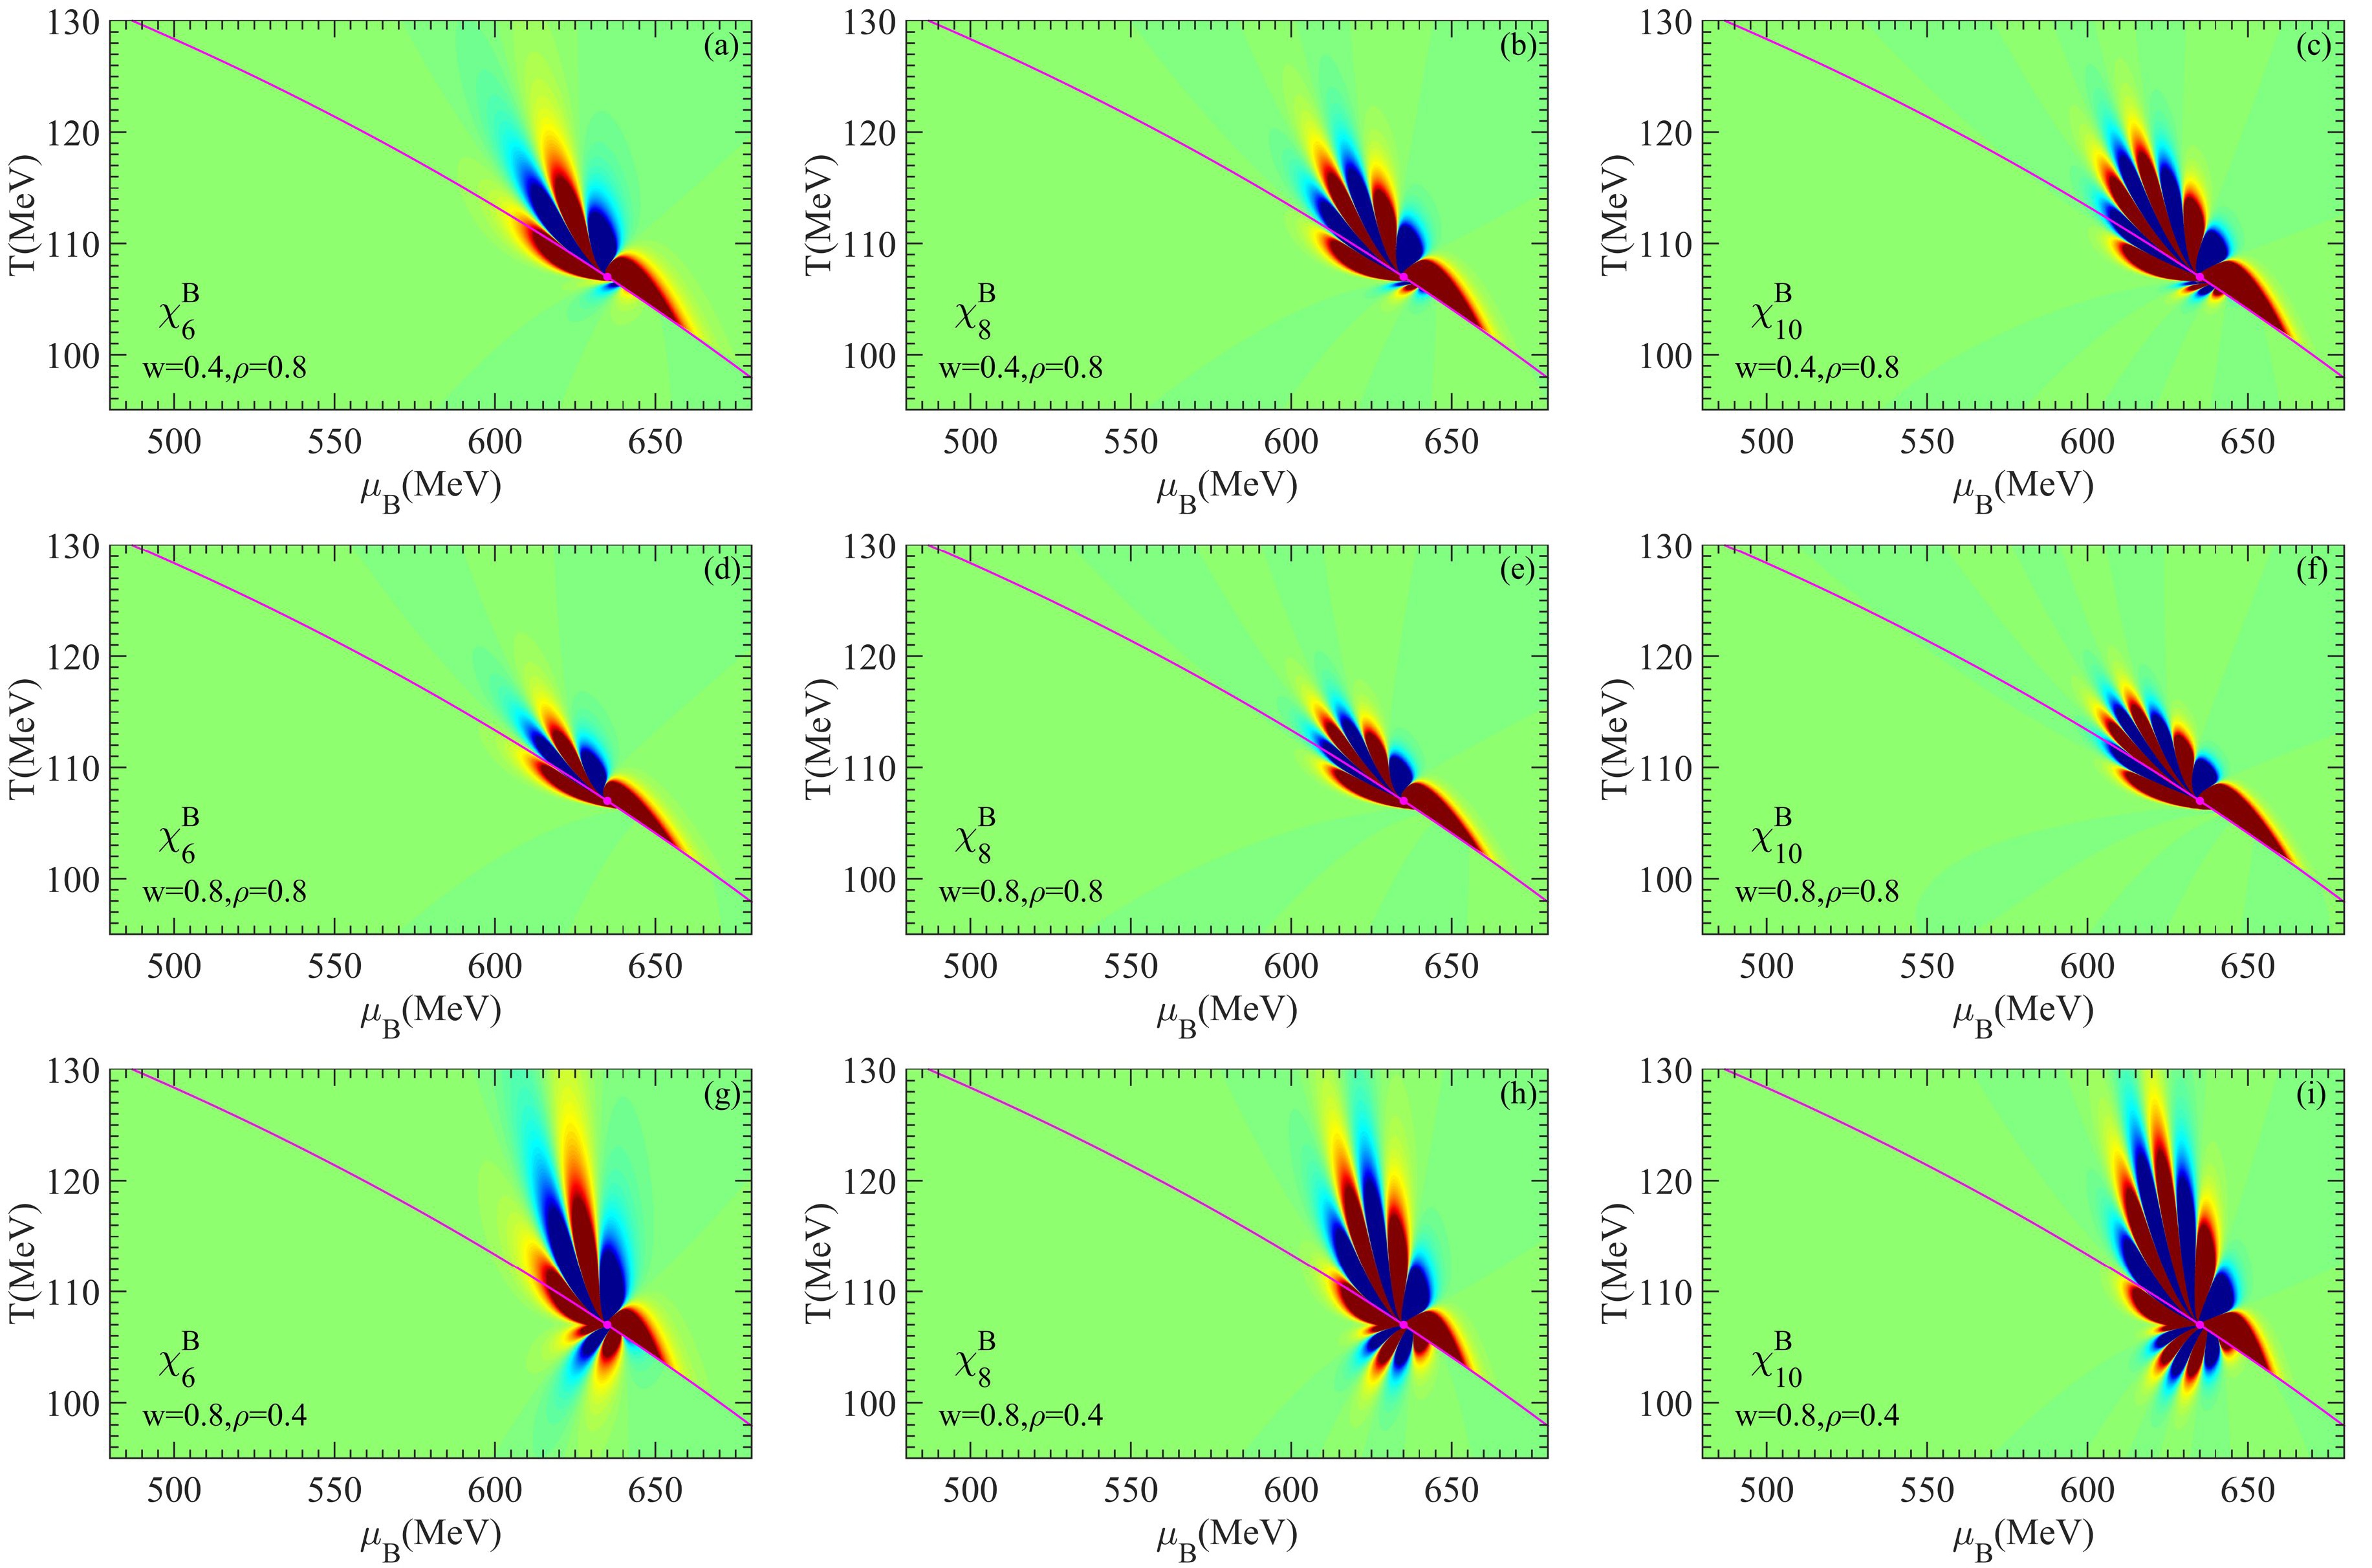
Figure 4. (color online) Density plots of critical contribution to
$ \chi_{6}^{B} $ ,$ \chi_{8}^{B} $ , and$ \chi_{10}^{B} $ in the QCD$ T-\mu_B $ phase plane with$ w=0.4,\rho=0.8 $ (top row),$ w=0.8 $ ,$ \rho=0.8 $ (middle row), and$ w=0.8,\rho=0.4 $ (bottom row). The critical point is indicated by a purple dot, and the chiral phase transition line is represented by the solid purple line. The green, yellow, and red areas correspond to positive values (the regions with the largest and smallest values are indicated in red and green, respectively) of the susceptibilities, whereas the blue ones correspond to negative values (the darker the blue, the larger the magnitude of the susceptibilities).In Fig. 4, the color schemes for
$ \chi_{2n}^{B} $ maintain consistency with the corresponding order of$ \chi_{2n}^{B,L} $ presented in Fig. 2. The purple curve shows the QCD phase transition line, as defined by Eq. (12), and the purple dot marks the critical point.Comparing the corresponding sub-figure in Fig. 4 with that in Fig. 2, we observe that the sub-leading critical contribution alters the pattern away from the critical point. We summarize three points as follows.
First, the area occupied by the primary pattern (consisting of the red and dark blue lobes) around the critical point in each sub-figure of Fig. 4 is larger than that in the corresponding sub-figure of Fig. 2.
Second, more lobes occur in the area above the phase transition line and fewer under the phase transition line, as shown in the middle row of Fig. 4, where the values of w and ρ are equal to
$ 0.8 $ . Additional lobes appear under the critical point at the larger$ \mu_B $ side, but their magnitudes are very small (the colors of the additional lobes are green or light blue). Extremely close to the phase transition line, negative values of the susceptibilities (dark blue lobes) can be observed under the phase transition line at the lower$ \mu_B $ side. Although not explicitly presented in this paper, note that for values of w and ρ that exceed$ 0.8 $ , the density plots of$ \chi_6^B $ ,$ \chi_8^B $ , and$ \chi_{10}^B $ are similar to that of the corresponding susceptibilities shown in the middle row of Fig. 4, respectively. The numbers of red and dark blue lobes in the density plots remain the same. The main effect of increasing values of w and ρ is the compression of the primary pattern in the T direction and the stretch of that in the$ \mu_B $ direction.Third, for smaller values of w or ρ, as shown in the top and bottom rows of Fig. 4, respectively, the additional lobes emerging below the critical point become obvious. Their colors become red and dark blue, which may result in additional positive peak and negative dips in the
$ \mu_B $ dependence of susceptibilities along the freeze-out curve. The higher the order of the susceptibility, the more additional lobes it has and more frequently its sign changes.To study the
$ \mu_B $ dependence of$ \chi_6^B $ ,$ \chi_8^B $ , and$ \chi_{10}^B $ in detail, except for$ \Delta T=1.0 $ MeV, we select another two freeze-out curves described in Eq. (19), where$ \Delta T $ is equal to$ 0.2 $ MeV and$ 2.0 $ MeV, respectively. The$ \mu_B $ dependence of the susceptibilities along the three different freeze-out curves are shown in the top, middle, and bottom rows of Fig. 5, respectively. In each sub-figure, the red, purple, black, cyan, and blue curves are for five different combinations of values of$ w= $ 0.4, 0.8, 1.6 and$ \rho= $ 0.4, 0.8, 1.6. The green horizontal and vertical dashed lines show the zero values of the susceptibilities and the net-baryon chemical potential$ \mu_{BC}=635 $ MeV at the QCD critical point, respectively.
Figure 5. (color online)
$ \mu_B $ dependence of$ \chi_{6}^{B} $ ,$ \chi_{8}^{B} $ , and$ \chi_{10}^{B} $ at$ \Delta T=0.2 $ MeV (top row),$ \Delta T=1.0 $ MeV (middle row) and$ \Delta T= 2.0 $ MeV (bottom row) for different values of w and ρ.In the top row of Fig. 5,
$ \Delta T=0.2 $ MeV, the freeze-out curve is very close to the phase transition line, and the negative dip in the$ \mu_B $ dependence of the susceptibilities is likely to appear based on their density plots shown in Fig. 4. To clearly observe the negative dip, we provide partial enlarged details for Fig. 5(a), Fig. 5(b), and 5(c). A negative dip followed by a positive peak can be observed in the cyan curve; similarly, in Fig. 5(b) and 5(c), this structure can also be observed in the black, blue, and red curves as we approach the critical point from the crossover side. However, compared with Fig. 3, the negative dip is less pronounced; for instance, for the cyan curves in Fig. 5(a), 5(b), and 5(c), the ratios of depth of negative dips to height of peaks are$ 0.016 $ ,$ 0.058 $ , and$ 0.099 $ , respectively, which are smaller than those of the red curves in Fig. 3.For the red and purple curves in each sub-figure in the top row of Fig. 5, additional negative dips or positive peaks are not observed at the larger
$ \mu_B $ side. This is because the magnitude of values of the additional lobes in the top and bottom rows of Fig. 4 is too small to form a pronounced dip or peak. The original red lobe dominates the main peak structure when the freeze-out curve is very close to the phase transition line.From the top row to the bottom row in Fig. 5, the freeze-out curve is located increasingly further from the phase transition line. The negative dip at the lower
$ \mu_B $ side fades in the red, black, cyan, and blue curves. Additionally, the additional positive peaks and negative dips in the red and purple curve at the larger$ \mu_B $ side emerge and become more pronounced.The
$ \mu_B $ dependence of$ \chi_6^B $ ,$ \chi_8^B $ , and$ \chi_{10}^B $ slightly differs from that of the fourth-order susceptibilities of the net-baryon number when$ \alpha_1 $ is small and$ \alpha_2 $ is not. In this scenario, the negative dip disappears in the fourth-order susceptibility for all values of w and ρ as reported in Ref. [28]. For$ \chi_6^B $ ,$ \chi_8^B $ , and$ \chi_{10}^B $ , the existence of the negative dip is dependent on the values of w and ρ, as well as the distance between the freeze-out curve with the phase transition line. When both w and ρ are large, a negative dip followed by a positive peak can be observed when the critical point is approached from the crossover side, provided that the freeze-out curve is very close to the phase transition line. However, the magnitude of this negative dip remains minimal. For small values of w and ρ, additional negative dips will emerge and become pronounced as the freeze-out curve is further from the phase transition line.While the presence of negative dips in the
$ \mu_B $ dependence of$ \chi_6^B $ ,$ \chi_8^B $ , and$ \chi_{10}^B $ relies on mapping parameters and the distance between the freeze-out curve and the phase transition line, a positive peak consistently emerges in the$ \mu_B $ dependence of susceptibilities as the critical point is approached from the crossover side. This occurrence remains unaffected by values of w and ρ, as well as by the distance between the freeze-out curve and phase transition line. Specifically, this positive peak is observed at the left side of vertical green dashed line in every sub-figure in Fig. 5. In contrast to the negative dips, this positive peak structure in net-baryon number susceptibilities represents a more robust characteristic of the critical point. -
Assuming the equilibrium of the QCD system, the results from the three-dimensional Ising model can be mapped to that of QCD based on the universality of critical behavior. Applying the common choice for the mapping, i.e., the Ising magnetic field is orthogonal to the temperature, we have investigated the critical behavior of the sixth-, eighth- and tenth-order susceptibilities of the net-baryon number. Both the leading and the sub-leading critical contributions from the Ising model are discussed.
When considering only the leading critical contribution, the general patterns of density plots for susceptibilities of the same order remain consistent across varying values of mapping parameters w and ρ. The higher the order of the susceptibility, the more lobes appear in the pattern of the density plot and the higher the frequency of sign changes. The common feature is the occurrence of a negative dip followed by a positive peak in the
$ \mu_B $ dependence of the sixth-, eighth-, and tenth-order susceptibilities of the net-baryon number when the critical point is approached from the crossover side.The sub-leading critical contribution significantly affects the behavior of the susceptibilities. In the
$ \mu_B $ dependence of the susceptibilities, the emergence of negative dips is not an absolute phenomenon; rather, it is dependent on the values of the mapping parameters, as well as the distance between the freeze-out curve and the phase transition line.Compared with the negative dip in the
$ \mu_B $ dependence of generalized susceptibilities of the net-baryon number, the positive peak structure is a more robust feature of the critical point, which is unaffected by values of w and ρ, as well as by the distance between the freeze-out curve and phase transition line, or sub-leading critical contribution.
Generalized susceptibilities of the net-baryon number based on the three-dimensional Ising universality class
- Received Date: 2024-08-20
- Available Online: 2025-02-15
Abstract: Assuming the equilibrium of the Quantum Chromodynamics (QCD) system, we investigate the critical behavior of the sixth-, eighth-, and tenth-order susceptibilities of the net-baryon number through mapping the results in the three-dimensional Ising model to that of QCD. Both the leading and sub-leading critical contributions from the Ising model are discussed. When considering only the leading critical contribution, the density plots of susceptibilities of the same order demonstrate a consistent general pattern independent of the values of the mapping parameters. As the critical point is approached from the crossover side, a negative dip followed by a positive peak is observed in the


 DownLoad: