


 Abstract
 HTML
HTML Reference
 Related
 PDF
PDF


-
Understanding the vast cosmic landscape has long been guided by the Lambda Cold Dark Matter (ΛCDM) model, anchored in the meticulous observations of Planck 2018 [1, 2]. This framework, a cornerstone in cosmology, notably measured the Hubble constant (H0) at 67.4 ± 0.5 km s−1Mpc−1 [1]. However, local measurements of H0 by the SHOES project, using cepheid stars, present a different narrative, resulting in a value of 73.04 ± 1.04 km s−1Mpc−1 [3, 4]. This deviation, known as Hubble tension, prompts a reevaluation of the ΛCDM model. The tension, at
4σ−5.7σ , hints at potential errors or limitations in our cosmological understanding, sparking a search for new physics [4]. Motivated by this tension, various alternative models have surfaced [5−17], offering new avenues for exploration. In response to Hubble tension, scientists have explored alternative observational avenues for estimating the Hubble constant. Studies involving quasar lensing [18, 19], gravitational wave events [20−22], fast radio bursts (FRBs) [23, 24], megamasers [25−27], the red giant branch tip method (TRGS) [28−30], and baryon acoustic oscillations (BAOs) [31] have provided valuable insights. For instance, the H0LiCOW research group, using the gravitational lensing effects under the ΛCDM scenario, suggested an alternative estimate ofH0=73.3+1.7−1.8 km s−1Mpc−1 [32]. The Advanced LIGO and Virgo teams, through the detection of the gravitational-wave event GW170817, independently measuredH0=70+12.0−8.0 km s−1Mpc−1 [21]. These independent observations offer a valuable perspective on Hubble tension. In the realm of observational techniques, BAOs come into focus. These acoustic oscillations, embedded in galactic structures, offer a unique opportunity to probe the large-scale structure of the universe. BAO surveys yield measurements includingDA(z)/rd ,DV(z)/rd ,DM(z)/rd ,DH/rd ,DA(rd/rd,fid) ,DV(rd/rd,fid) , andH(z)⋅rd , where rd represents the sound horizon distance at drag epoch. BAOs not only showcase observational robustness but also form theH0−rd plane, connecting the early- and late-time universes. The intricate relationship between H0 and rd underscores the potential of BAOs to bridge existing gaps in our understanding.Albert Einstein's revolutionary General Theory of Relativity, proposed in 1915, illuminates gravity and cosmic dynamics [33]. Its predictions, validated over decades, span from light bending around massive objects to the universe's expansion. However, as we have embarked on cosmic studies, General Relativity (GR) reveals limitations. While GR elegantly portrays cosmic gravity, challenges arise in extreme conditions near black holes [34]. Reassessing GR's cosmic applicability becomes crucial in understanding dark energy and dark matter. The clash between GR and quantum mechanics, foundational in physics, surfaces as we reconcile their disparate principles [35]. The universe's accelerated expansion, attributed to elusive dark energy, challenges GR [36]. Alternative models probe this cosmic mystery [37]. Singularities within black holes and the Big Bang raise questions about spacetime and GR's limits [38]. GR's limitations spur exploration into modified gravity [39], transcending Einstein's paradigm to address cosmic enigmas and Hubble tension in our continuing quest for understanding. In the ongoing exploration of the late universe over the past twenty-five years, numerous cosmological models have emerged, introducing a spectrum of dark energy candidates, such as the cosmological constant, quintessence, k-essence, spintessence, and phantom [40−47]. Additionally, alternative approaches involving higher-order equations of state, including the chaplygin gas, polytropic gas, and Vander Waal's gas, have been explored [48−53]. The investigation of modified gravity theories has also garnered substantial attention [54−58]. This diverse array of models seeks to deepen our understanding of the late universe, offering insights into its complex and evolving nature.
However, it is important to note that these two methods are not the sole avenues for understanding late cosmic acceleration and researchers are working with different approach. In this paper, we delve into a noteworthy modified gravity model with intriguing characteristics, known as Horava-Lifshitz Gravity (HLG). Among the many modified gravity theories, HLG has garnered significant attention. HLG departs from the conventional framework of GR by introducing anisotropy and scale invariance. The theory was initially proposed by Petr Horava, drawing inspiration from condensed matter physics and quantum gravity [59]. HLG has generated considerable interest due to its potential to provide a unique solution to the cosmic acceleration problem while maintaining a high degree of renormalizability. HLG offers several intriguing features that set it apart from other modified gravity theories [60−64]. It exhibits power-counting renormalizability in the ultraviolet (UV) regime, which could have profound implications for the quantum behavior of gravity. Additionally, HLG introduces a preferred foliation of spacetime, which allows for a departure from the full diffeomorphism invariance of GR. This feature can give rise to unique cosmological scenarios and potentially address the issues surrounding cosmic acceleration. In recent years, HLG has been the subject of intense research activity, both in the context of gravitational physics and Cosmology. Cosmologists have sought to investigate the cosmological consequences of HLG, exploring its predictions for the evolution of the universe, the formation of the large-scale structure, and its compatibility with observational data. Furthermore, theoretical physicists have continued to refine and extend the formalism of HLG, seeking a deeper understanding of its underlying principles and its relationship with quantum gravity.
The motivation for undertaking research on HLG lies in its potential to provide a novel and compelling solution to the cosmic acceleration problem. While the ΛCDM model with a cosmological constant has been successful in explaining a broad range of cosmological observations, it raises fundamental questions about the nature of dark energy and the apparent fine-tuning of its energy density. HLG offers an alternative framework that may alleviate some of these concerns and provide new insights into the dynamics of the universe.
In this study, we aim to comprehensively explore HLG in the context of modern Cosmology. To assess the viability of HLG as a cosmological model, we conduct a detailed cosmographic analysis. This involves defining and constraining the cosmographic parameters associated with HLG and comparing its predictions with a wealth of observational data. Over the years, various types of parametrization techniques have been employed in cosmology, ranging from simple polynomial forms to more sophisticated methods [64−86]. Parametrizations of the equation of state (EoS) for dark energy stand as crucial tools in deciphering the intricacies of the cosmic force steering the universe's accelerated expansion. The EoS, a key metric denoting the ratio of pressure to energy density, acts as a fundamental descriptor for the evolving nature of dark energy across cosmic epochs. Among the widely recognized parametrizations is the Chevallier-Polarski-Linder (CPL) model, employing a linear scale factor-dependent function to explore deviations from the cosmological constant and discern nuances in dark energy behavior. Additionally, the ΛCDM model offers a more versatile approach, introducing time-dependent dark energy density to capture potential transitions in its behavior over time. Both the CPL and ΛCDM parametrizations are instrumental in interpreting diverse observational datasets, including data on Type Ia supernovae, cosmic microwave background radiation, and large-scale structure surveys. Parametrizations serve as invaluable tools for aligning theoretical predictions with observational data, enabling researchers to constrain dark energy properties and differentiate between cosmological scenarios. As precision in observational datasets continues to improve, the pursuit of more accurate and adaptable parametrization schemes persists. Recent advancements include the integration of redshift-dependent parametrizations and non-parametric reconstructions of the EoS, aiming to capture subtler features in dark energy behavior. In essence, the study and refinement of EoS parametrizations remain pivotal in cosmological research, offering a nuanced framework to explore the profound mysteries of dark energy and the dynamic evolution of the universe. A detailed list of various parametrization schemes of EoS and others are given in references [87, 88].
The rest of this paper is structured as follows. In Sec. II, we introduce the fundamental equations that form the basis of HLG and present the field equations associated with this gravitational framework. Furthermore, we derive the modified Friedmann equations within the context of HLG. In Sec. III, we introduce three distinct dark energy parametrizations: the Wettrich, Efstathiou, and Ma-Zhang models. In Sec. IV, we provide details about the datasets and methodology employed. In Sec. V, we explore cosmographic parameters, with a particular focus on the deceleration, jerk, and Snap parameters. In Sec. VII, the Om diagnostic test is described. Section VI explores the
rd−H0 plane and illustrates how our outcomes are sensitive to priors for rd and H0, consequently influencing values in therd−H0 plane. Sections VIII and IX focus on the evolution of the EoS parameter and statistical analysis, respectively. Finally, Secs. X and XI are dedicated to discussing the results and presenting conclusions, respectively. -
The Arnowitt-Desert-Misner metric decomposition is advantageous, and it can be formulated as follows [89−91]:
ds2=−N2dt2+gij(dxi+Nidt)(dxj+Njdt).

(1) In this context, N represents the lapse function,
Ni denotes the shift vector, andgij corresponds to the spatial metric. The coordinate scaling transformation is expressed as follows:t→l3t andxi→lxi . The HLG action comprises two components, specifically, the kinetic and potential terms, formulated as follows:Sg=Sk+Sv=∫dtd3x√gN(Lk+Lv),

In this context, the kinetic term is defined as follows:
Sk=∫dtd3x√gN[2(KijKij−λK2)κ2],

In this situation, the extrinsic curvature is defined as
Kij=˙gij−ΔiNj−ΔjNi2N.

The Lagrangian, represented by
Lv , exhibits a reduction in the number of invariants due to its inherent symmetric property, as previously discussed in [59, 60−92]. This symmetry, often termed detailed balance, plays a crucial role. Considering the implications of detailed balance, the expression for the action can be expanded as follows:Sg=∫dtd3x√gN[2(KijKij−λK2)κ2+κ2CijCij2ω4−κ2μϵijkRi,jΔjRlk2ω2√g+κ2μ2RijRij8−κ2μ28(3λ−1){(1−4λ)R24+ΛR−3Λ2}]

In this context, the expression
Cij=ϵijkΔk(Rji−R4δji)√g represents the Cotton tensor, with all covariant derivatives determined with respect to the spatial metricgij . The symbolϵijk denotes a totally antisymmetric unit tensor, whileλ is a dimensionless constant, andκ ,ω , andμ are constants. Horava derived a gravitational action under the assumption of temporal dependence solely on the lapse function (i.e.,N≡N(t) ). Utilizing the Friedmann Robertson Walker (FRW) metric, where N=1,gij=a2(t)γij ,Ni=0 , andγijdxidxj=dr21−kr2+r2dΩ22

with k = –1, 1, 0 representing an open, closed, and flat universe, respectively, and considering variations of N and
gij , the resulting equations are identified as the Friedmann equations [93, 94]H2=κ2ρ6(3λ−1)+κ26(3λ−1)[3κ2μ2k28(3λ−1)a4+3κ2μ2Λ28(3λ−1)]−κ4μ2Λk8(3λ−1)2a2,

(2) ˙H+3H22=−κ2p4(3λ−1)−κ24(3λ−1)×[3κ2μ2k28(3λ−1)a4+3κ2μ2Λ28(3λ−1)]−κ4μ2Λk8(3λ−1)2a2

(3) The term proportional to
1a4 constitutes a distinctive contribution within HLG, often interpreted as the "Dark radiation term" [90, 91]. In this framework, the constant term is associated with the cosmological constant. Here,H=˙aa represents the Hubble parameter, and the dot signifies a derivative with respect to cosmic time t. Considering the universe's composition with both dark matter (DM) and dark energy (DE), the total energy densityρ and total pressure p can be expressed asρ=ρm+ρd andp=pm+pd , respectively. Assuming distinct conservation equations for DM and DE, we derive˙ρm+3H(ρm+pm)=0,

(4) and
˙ρd+3H(ρd+pd)=0.

(5) As dark matter exhibits pressurelessness, i.e.,
pm=0 , Eq. (4) leads toρm=ρm0a−3 . Let the equation of state parameter be denoted asw(z)=p/ρ . Consequently, from Eq. (5), we deriveρd=ρd0e3∫1+w(z)1+zdz . Here,ρm0 andρd0 represent the present values of the energy densities of dark matter (DM) and dark energy (DE), respectively. IntroducingGc=κ216π(3λ−1) under the conditionκ4μ2Λ8(3λ−1)=1 and adhering to detailed balance, the above Friedmann equations can be expressed asH2=8πGc3(ρm+ρd)+(k22Λa4+Λ2)−ka2,

(6) ˙H+32H2=−4πGcpd−(k24Λa4+3Λ4)−k2a2.

(7) Using the dimensionless parameters
Ωi0≡8πGc3H20ρi0 ,Ωk0=−kH20 , andΩΛ0=Λ2H20 , we obtainH2(z)=H20[Ωm0(1+z)3+Ωk0(1+z)2+ΩΛ0+Ω2k0(1+z)44ΩΛ0+Ωd0e3∫1+w(z)1+zdz]

(8) with
Ωm0+Ωd0+Ωk0+ΩΛ0+Ω2k04ΩΛ0=1

(9) The observational data analysis for linear, CPL, and JBP models in HLG have been studied in [95], where they used the Stern+BAO+CMB datasets. However, in the next sections, we will assume some other parametrizations, such as those of Wettrich, Efstathiou, and Ma-Zhang in the framework of HLG, and we will study the data analysis with the MCMC method.
-
The Wettrich parametrization is assumed as [44, 45]
w(z)=w01+w1log(1+z)

(10) The solution is
ρd=ρd0(1+z)3[1+w1log(1+z)]3w0w1

(11) Thus, from Eq. (8), we obtain
H2(z)=H20[Ωm0(1+z)3+Ωk0(1+z)2+ΩΛ0+Ω2k0(1+z)44ΩΛ0+(1−Ωm0−Ωk0−ΩΛ0−Ω2k04ΩΛ0)(1+z)3(1+w1log(1+z))3w0w1]

(12) -
The Efstathiou parametrization [46, 47] is assumed as
w(z)=w0+w1log(1+z)

(13) The solution is obtained as
ρd=ρd0(1+z)3(1+w0)e32w1[log(1+z)]2

(14) Thus, from Eq. (8), we obtain
H2(z)=H20[Ωm0(1+z)3+Ωk0(1+z)2+ΩΛ0+Ω2k0(1+z)44ΩΛ0+(1−Ωm0−Ωk0−ΩΛ0−Ω2k04ΩΛ0)(1+z)3(1+w0)e32w1[log(1+z)]2]

(15) -
The Ma-Zhang parametrization is assumed as [48, 49]
w(z)=w0+w1(log(2+z)1+z−log2)

(16) The solution is obtained as
ρd=ρd026w1(1+z)3(1+w0+w1−w1log2)(2+z)−3w1(2+z)1+z

(17) Thus, from Eq. (8), we obtain
H2(z)=H20[Ωm0(1+z)3+Ωk0(1+z)2+ΩΛ0+Ω2k0(1+z)44ΩΛ0+(1−Ωm0−Ωk0−ΩΛ0−Ω2k04ΩΛ0)26w1(1+z)3(1+w0+w1−w1log2)(2+z)−3w1(2+z)1+z]

(18) -
In our examination of the late-stage cosmic expansion of the universe, we utilized a comprehensive dataset containing the latest BAO measurements obtained from a variety of observational sources. These data points have been carefully selected from different sources, including the Sloan Digital Sky Survey (SDSS) [96−101]. Furthermore, our dataset incorporates measurements from other significant surveys, such as the Dark Energy Survey (DES) [101], Dark Energy Camera Legacy Survey (DECaLS) [102], and 6dF Galaxy Survey BAO (6dFGS BAO) [103]. It is important to note that the BAO dataset presents a notable challenge due to the potential presence of correlations among measurements stemming from different data releases. To address this challenge and evaluate systematic errors, it is common practice to generate mock datasets using N-body simulations with well-defined cosmological parameters. These mock datasets allow us to derive the appropriate covariance matrices, aiding in the precise analysis of the BAO measurements. Given that our analysis combines data from multiple experiments, it is essential to acknowledge that we lack the precise covariance matrix outlining their interconnections, as such information is not readily available. In lieu of this, we conducted a covariance analysis following the methodology proposed in [104]. For uncorrelated data points, the covariance matrix can be expressed as
Cii=σ2i . To account for potential correlations among data points, we introduced a specific number of non-diagonal elements into the covariance matrix, ensuring its symmetry. This approach allows us to introduce positive correlations among up to twelve pairs of randomly selected data points, encompassing more than 66.6% of the dataset. The positions of these non-diagonal elements are determined randomly, and the magnitude of these selected covariance matrix elements, denoted asCij , is set toCij=0.5σiσj . Here,σi andσj represent the published 1σ errors associated with data points i and j', respectively. To refine our cosmological model parameters, we enhance the dataset by including 24 BAO data points, as detailed in Table 1, including the latest measurement of the Hubble constant,H0=73.04±1.04 (km/s)/Mpc, as an additional prior known as R22 [4]. In our analysis, we utilized a nested sampler implemented in the open-source package Polychord [105], in conjunction with the GetDist package [106] for presenting the results. Figures 1, 2, and 3 depict the 68% and 95% confidence levels for key cosmological parameters for the Wettrich, Efstathiou, Ma-Zhang, and ΛCDM models. Table 2 presents the best-fit values of each model's parameters along with the current Hubble constant H0.BAO Dataset zeff 

Observable Measurement Error Year Dataset Survey Reference 0.106 rd/DV 

0.336 0.015 2011 6dFGS BAO [41] 0.15 DV/rd 

4.47 0.17 2021 SDSS Main Galaxy Sample [107] 0.31 DA/rd 

6.29 0.14 2017 SDSS-III BOSS-DR12 [108] 0.36 DA/rd 

7.09 0.16 2017 SDSS-III BOSS-DR12 [108] 0.38 DH/rd 

25.00 0.76 2021 SDSS BOSS Galaxy Sample [108] 0.40 DA/rd 

7.70 0.16 2017 SDSS-III BOSS-DR12 [108] 0.44 DA/rd 

8.20 0.13 2017 SDSS-III BOSS-DR12 [108] 0.48 DA/rd 

8.64 0.11 2017 SDSS-III BOSS-DR12 [108] 0.51 DM/rd 

13.36 0.21 2021 SDSS BOSS Galaxy Sample [107] 0.52 DA/rd 

8.90 0.12 2017 SDSS-III BOSS-DR12 [108] 0.56 DA/rd 

9.16 0.14 2017 SDSS-III BOSS-DR12 [108] 0.59 DA/rd 

9.45 0.17 2017 SDSS-III BOSS-DR12 [108] 0.64 DA/rd 

9.62 0.22 2017 SDSS-III BOSS-DR12 [108] 0.697 DA(rd/rd,fid) 

1529 73 2020 DECaLS DR8 Footprint LRG [102] 0.698 DH/rd 

19.77 0.47 2020 eBOSS DR16 LRG Sample [98] 0.698 DM/rd 

17.65 0.30 2020 eBOSS DR16 LRG Sample [98] 0.70 DM/rd 

17.96 0.51 2021 eBOSS DR16 ELG Sample [109] 0.835 DM/rd 

18.92 0.51 2022 Dark Energy Survey Year 3 [110] 0.845 DH/rd 

20.91 2.86 2021 eBOSS DR16 ELG Sample [109] 0.874 DA(rd/rd,fid) 

1680 109 2020 DECaLS DR8 Footprint LRG [102] 1.48 DH/rd 

13.23 0.47 2021 eBOSS DR16 Quasar Sample [100] 1.48 DM/rd 

30.21 0.79 2021 eBOSS DR16 Quasar Sample [100] 2.33 DH/rd 

8.99 0.19 2020 eBOSS DR16 Ly α -Quasar

[101] 2.33 DM/rd 

37.5 1.1 2020 eBOSS DR16 Ly α -Quasar

[101] Table 1. 24 independent BAO data points that form the basis of our analytical investigation. The data primarily originate from the conclusive measurements of the SDSS-III BOSS-DR12 and SDSS-IV eBOSS-DR16 datasets, contributing to the reinforcement of our findings.
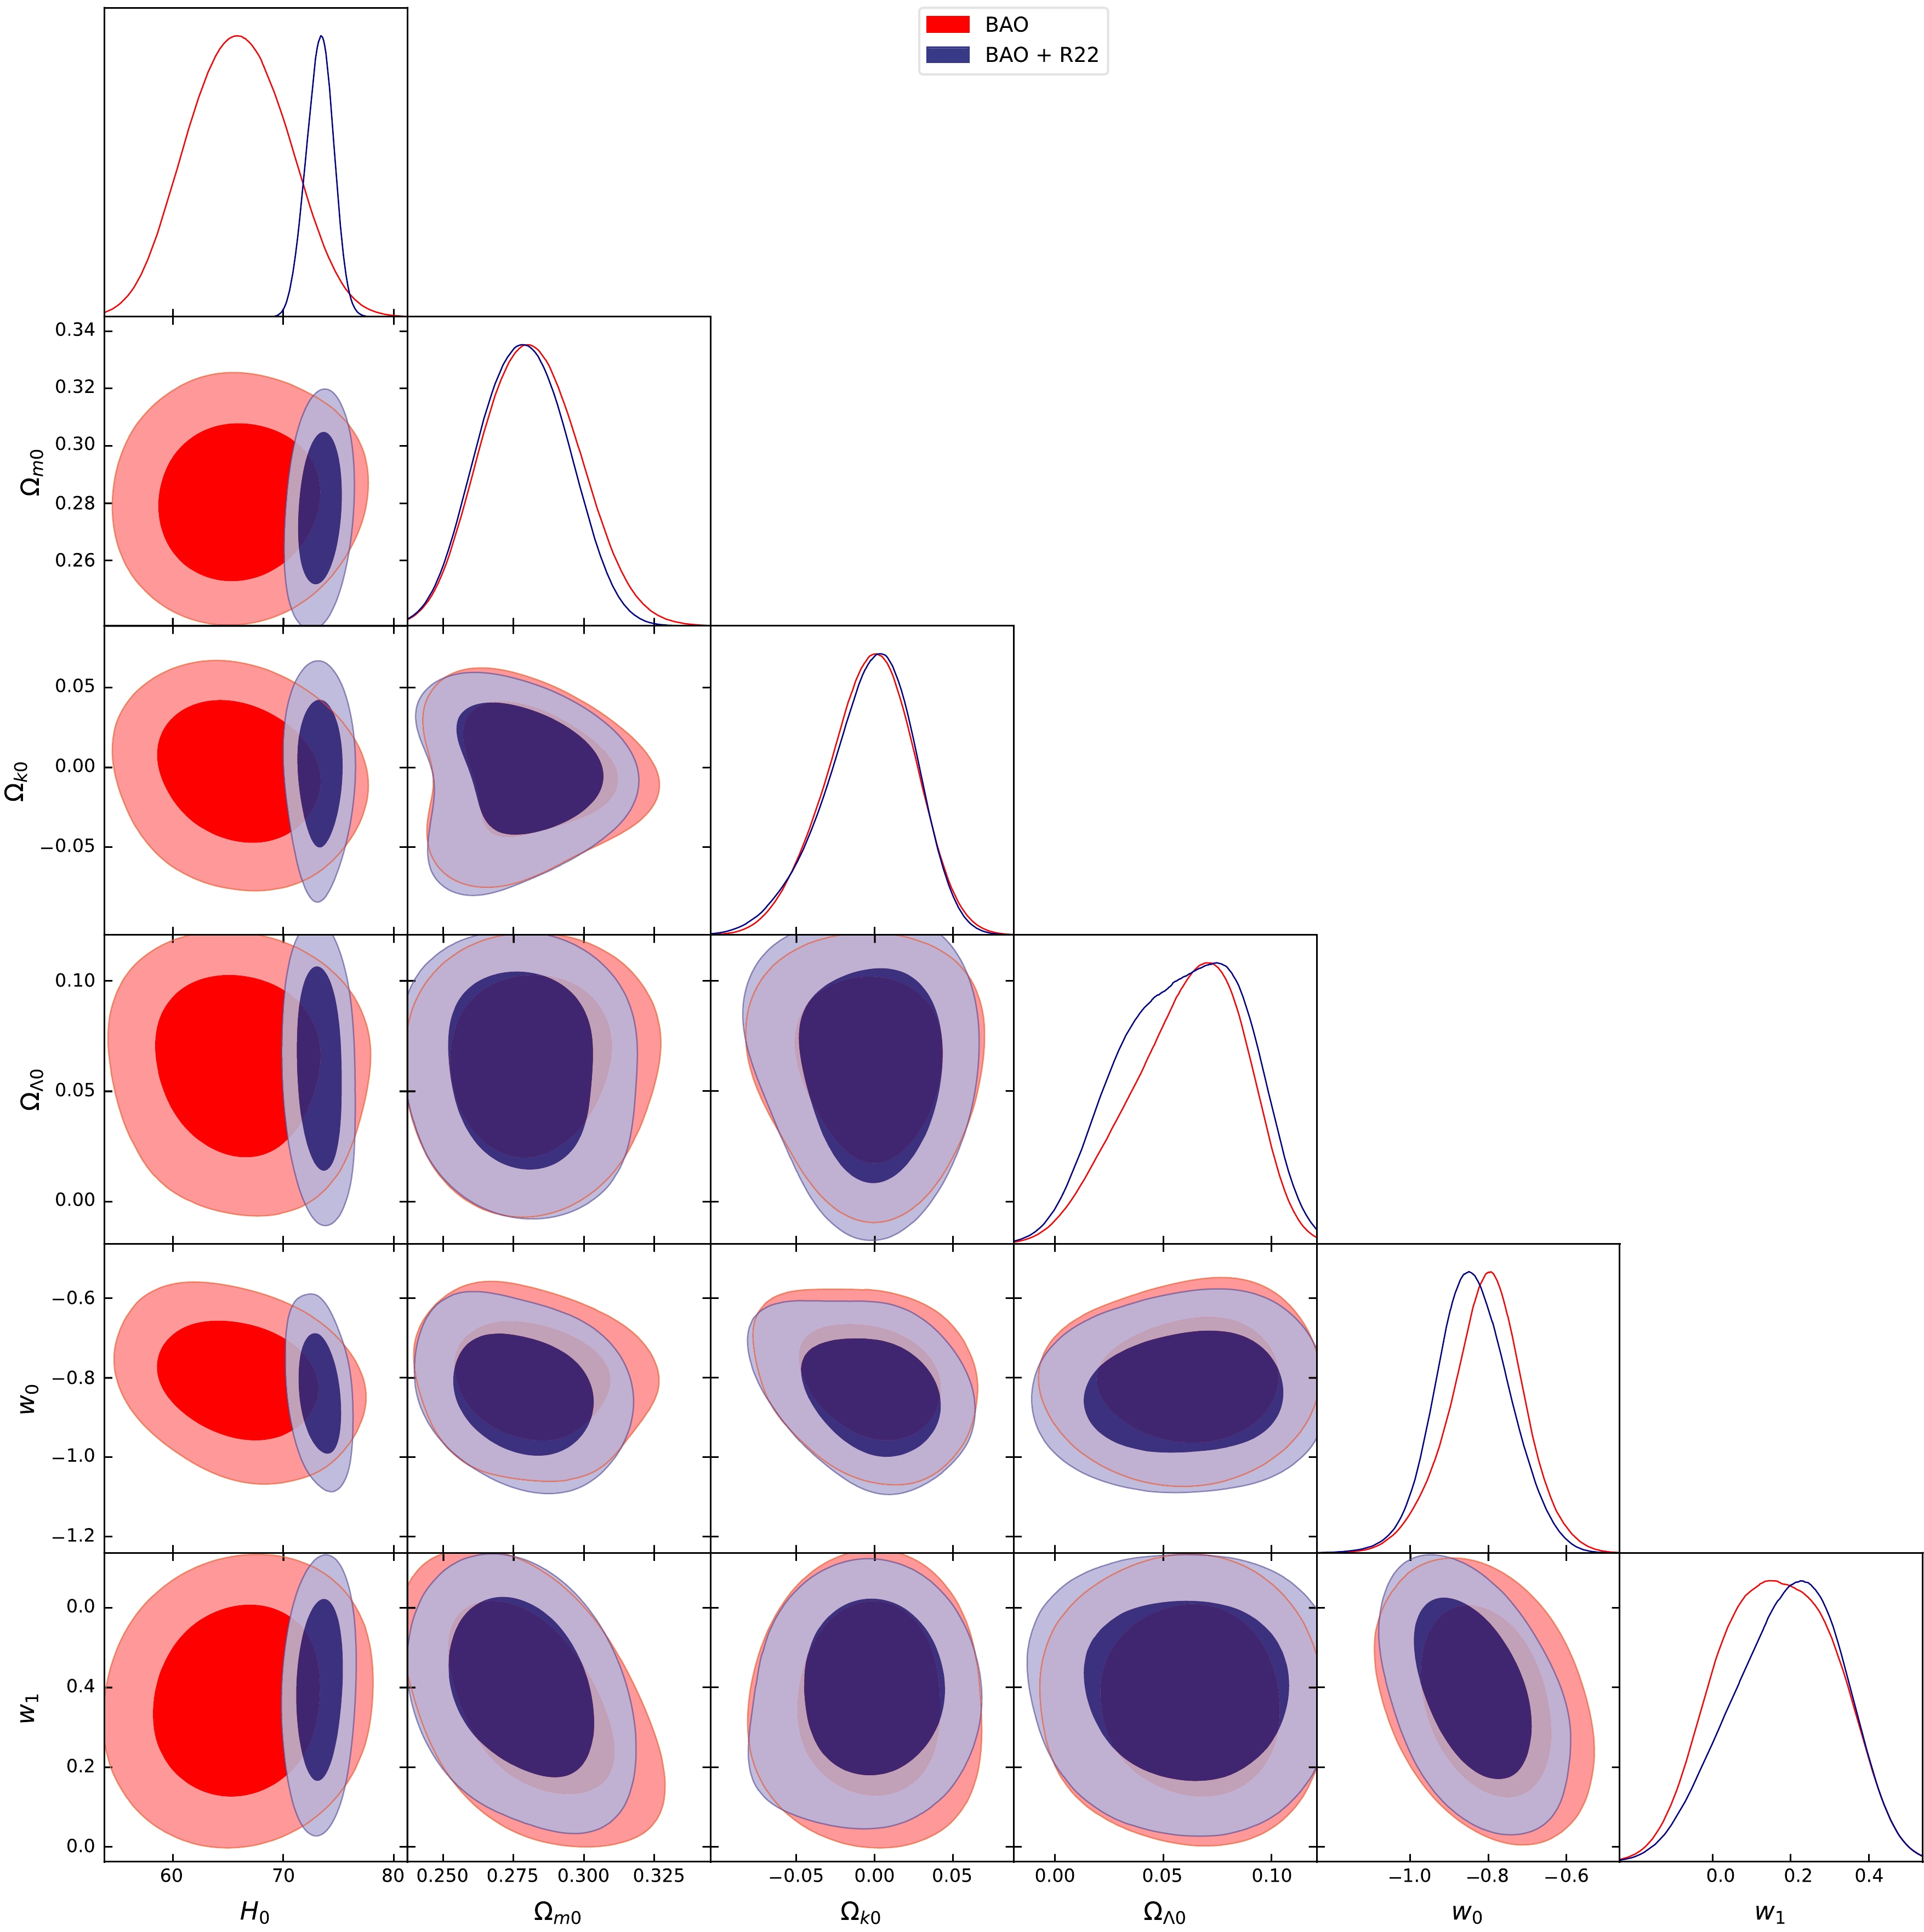
Figure 1. (color online) Posterior distribution of BAO dataset measurements using the Wettrich type model, highlighting the 1
σ and 2σ confidence levels.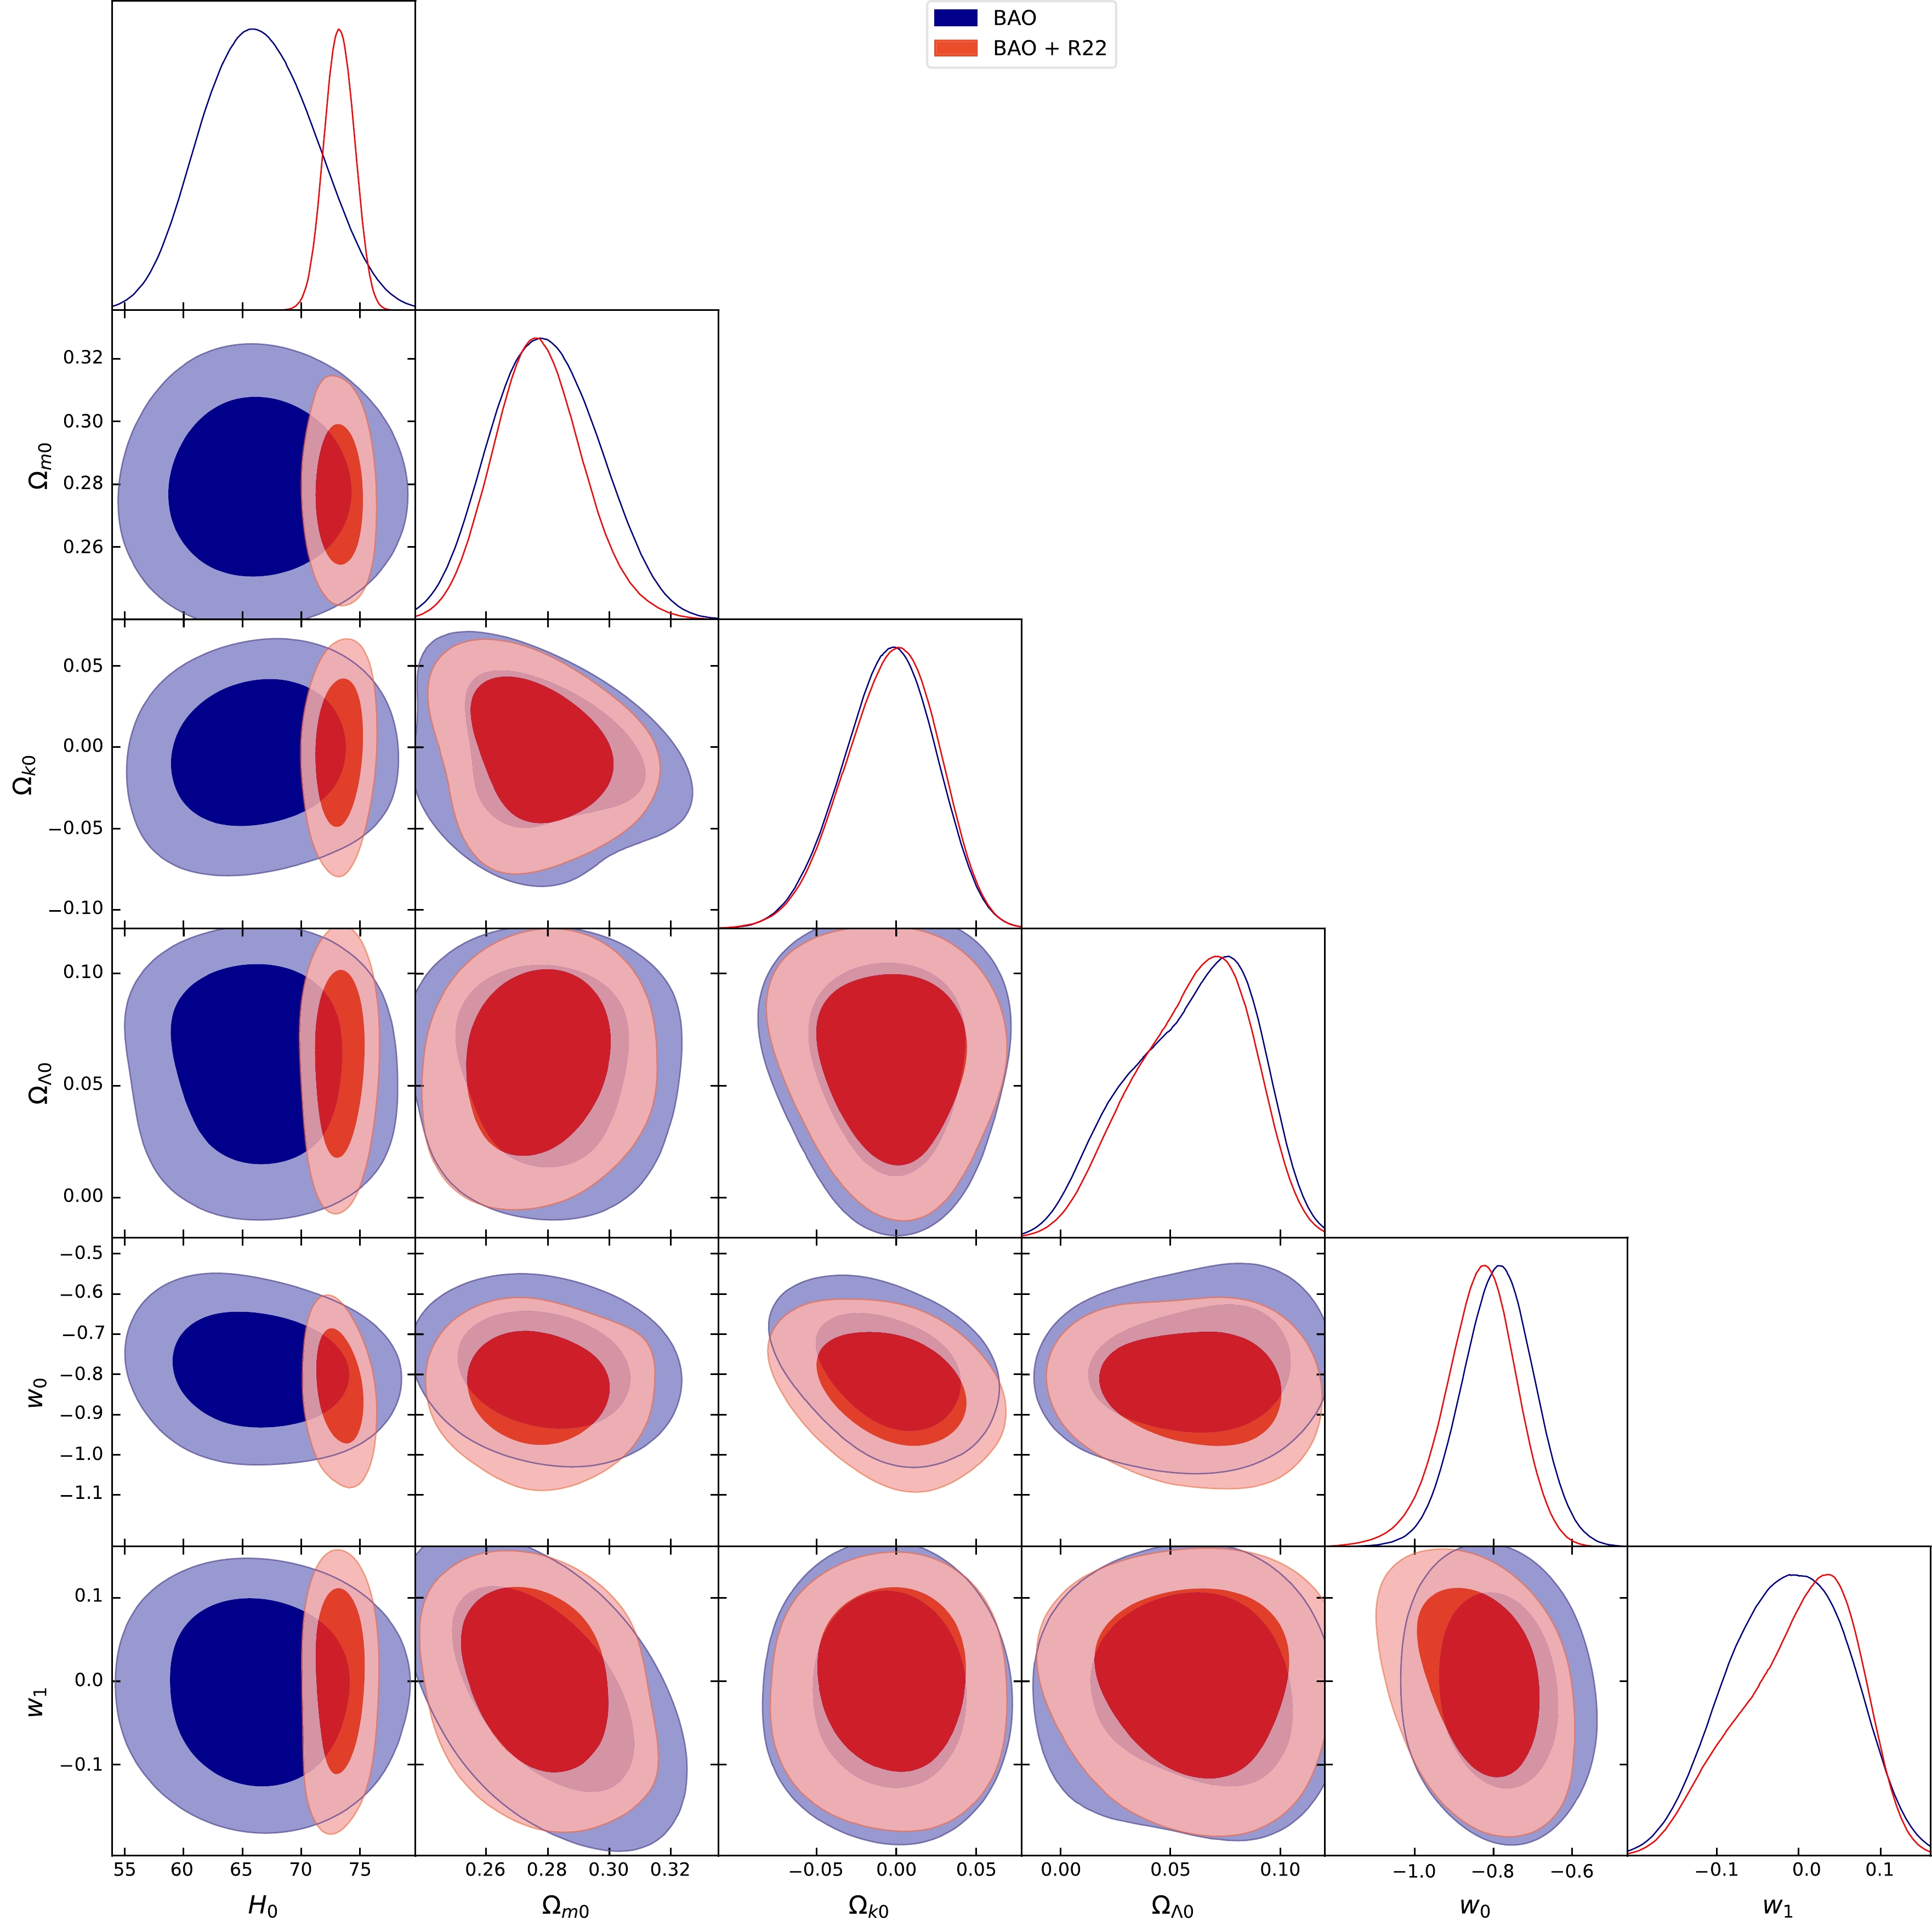
Figure 2. (color online) Posterior distribution of BAO dataset measurements using the Efstathiou type model, highlighting the 1
σ and 2σ confidence levels.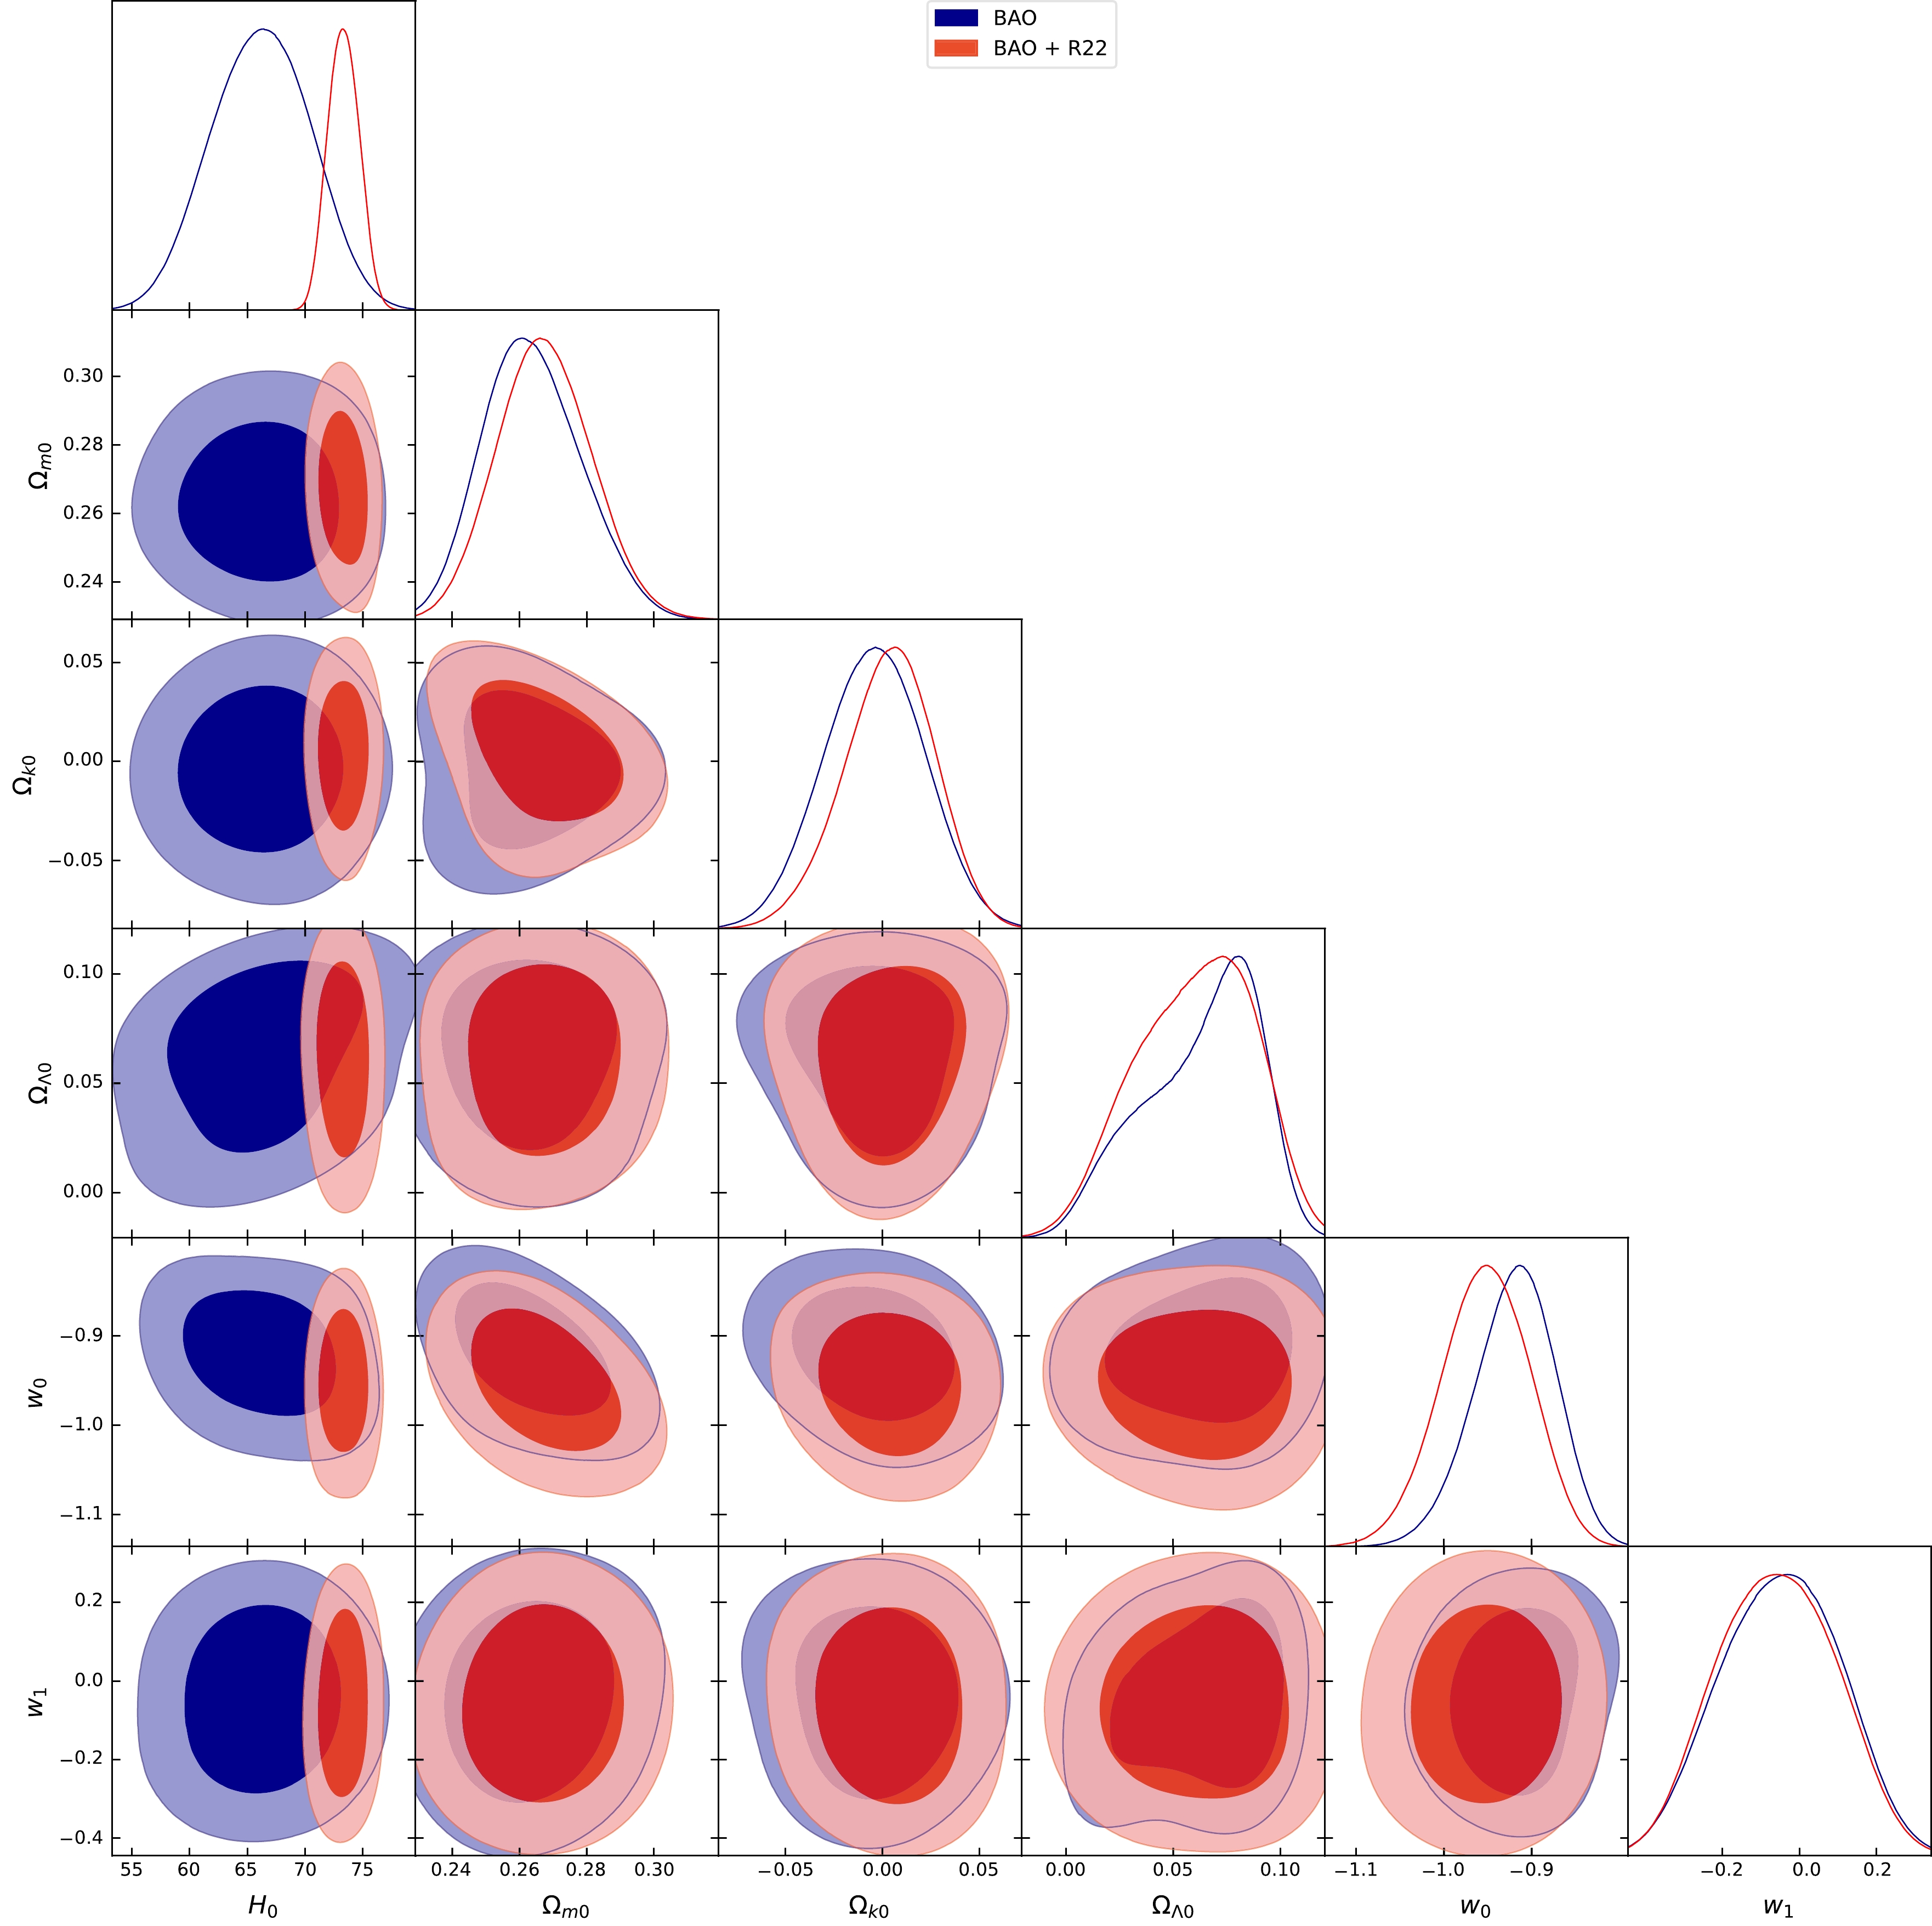
Figure 3. (color online) Posterior distribution of BAO dataset measurements using the Ma-Zhang type model, highlighting the 1
σ and 2σ confidence levels.MCMC Results Model Parameters Priors BAO BA0 + R22 H0 [50, 100] 68.33+7.03−5.00 

73.76+2.26−1.20 

ΛCDM Model Ωm0 

[0.00,1.00] 0.27+0.04−0.01 

0.27+0.03−0.01 

rd (Mpc) [100.00,200.00] 149.90+23.88−10.63 

138.39+4.68−2.25 

rd/rfid 

[0.90,1.10] 1.00+0.09−0.07 

0.93+0.03−0.02 

H0 [50, 80] 66.08+7.40−4.46 

73.24+2.28−1.14 

Ωm0 

[0.24,0.35] 0.27+0.05−0.03 

0.28+0.02−0.01 

Ωk0 

[-0.10,0.10] 0.01+0.08−0.04 

−0.00+0.05−0.02 

Wettrich Model ΩΛ0 

[0.00,0.10] 0.08+0.06−0.03 

0.06+0.04−0.03 

w0 

[-1.20,-0.50] −0.78+0.22−0.10 

−0.84+0.17−0.09 

w1 

[0.00,0.50] 0.12+0.26−0.17 

0.21+0.25−0.14 

rd (Mpc) [100.00,200.00] 150.24+15.29−10.17 

136.08+5.00−2.57 

rd/rfid 

[0.90,1.10] 1.00+0.09−0.06 

0.92+0.02−0.01 

H0 [50, 80] 66.36+7.77−4.95 

73.22+2.30−1.23 

Ωm0 

[0.24,0.35] 0.28+0.02−0.01 

0.28+0.02−0.01 

Ωk0 

[-0.10,0.10] −0.00+0.06−0.02 

−0.00+0.05−0.02 

Efstathiou Model ΩΛ0 

[0.00,0.10] 0.06+0.05−0.03 

0.06+0.05−0.02 

w0 

[-1.20,-0.50] −0.78+0.16−0.09 

−0.83+0.20−0.08 

w1 

[-0.10,0.10] 0.10+0.25−0.14 

0.16+0.29−0.16 

rd (Mpc) [100.00,200.00] 149.49+16.10−11.53 

136.07+4.71−2.32 

rd/rfid 

[0.90,1.10] 1.00+0.08−0.06 

0.92+0.01−0.01 

H0 [50, 80] 66.21+7.75−4.52 

73.32+2.15−1.38 

Ωm0 

[0.24,0.35] 0.26+0.02−0.01 

0.27+0.02−0.01 

Ωk0 

[-0.10,0.10] −0.00+0.04−0.02 

0.00+0.04−0.02 

Ma-Zhang Model ΩΛ0 

[0.00,0.10] 0.06+0.05−0.03 

0.06+0.05−0.03 

w0 

[-1.20,-0.50] −0.97+0.20−0.09 

−0.92+0.19−0.09 

w1 

[-0.50,0.00] −0.15+0.24−0.17 

−0.16+0.23−0.17 

rd (Mpc) [100.00,200.00] 150.82+15.58−9.31 

137.02+5.76−3.11 

rd/rfid 

[0.90,1.10] 1.00+0.09−0.05 

0.93+0.02−0.02 

Table 2. At a 95% confidence level (CL), we provide constraints on cosmological parameters for the Wettrich, Efstathiou, Ma-Zhang, and ΛCDM models. BAOs and Hubble constant measurements are incorporated as Gaussian priors.
-
Cosmography analysis is a cornerstone in modern cosmology [111] and provides an invaluable lens through which we delve into the enigmatic story of the universe's expansion. This research article endeavors to harness the power of cosmography, enabling us to unlock profound insights into cosmic dynamics. Through the meticulous analysis of observational data, we navigate the cosmos, comparing our findings to a range of theoretical models, including the Wettrich, Efstathiou, and Ma-Zhang models, alongside the well-established ΛCDM paradigm. This approach unveils how the universe's evolution unfolds across various redshifts. Cosmography, a potent tool, allows us to traverse the annals of time, enhancing our comprehension of the universe's past, present, and future.
-
The deceleration parameter [112], symbolized as "q," was initially postulated by Edwin Hubble in the early 20th century, and it is a fundamental cosmological parameter that is necessary to study the dynamics of the universe's expansion. Its mathematical definition is as follows:
q=−a¨a˙a2,

(19) Here, "a(t)" signifies the universe's scale factor over time, "
˙a " represents its first derivative, and "¨a " is the second derivative. Gaining crucial insights into the past and future of cosmic evolution depends critically on the deceleration parameter. A positive number indicates a slowing down of the expansion, similar to a time when gravity was the primary driver. When the deceleration parameter is zero, the expansion rate is constant and the universe is called a "critical universe." Meanwhile, a negative deceleration parameter means that expansion is speeding, which is related to the recent finding of dark energy in cosmology. In order to better comprehend the general geometry of the universe, this parameter is crucial in examining the nature of cosmic elements like dark matter and dark energy. It is also essential for determining the general geometry of the universe. -
Within cosmology, a deeper understanding of the universe's dynamics has led to the development of the "jerk parameter," denoted by j [112]. As a contrasting measure to the deceleration parameter, this offers a more nuanced perspective on cosmic acceleration. It is mathematically represented as
j=1ad3adτ3[1adadτ]−3=q(2q+1)+(1+z)dqdz,

(20) To improve our understanding of cosmic development, the jerk parameter is a critical quantity that represents the third time derivative of the universe's scale factor.
-
Adding further depth to our cosmological toolkit, the snap parameter [113], symbolized as "
s0 ," encapsulates the fifth time derivative of the expansion factor. In the Taylor expansion of the scale factor, it embodies the fourth-order term:s=1ad4adτ4[1adadτ]−4=j−13(q−12).

(21) The snap parameter unveils the curvature of the universe and its manner of expansion, serving as a critical piece of the cosmographic puzzle.
-
In our study, we employed a robust diagnostic tool for probing DE known as the Om diagnostic, initially introduced by [113]. This diagnostic method is particularly notable for its simplicity, relying solely on the directly measurable Hubble parameter
H(z) obtained from observational data. The Om diagnostic serves as a valuable instrument for discerning between cosmological scenarios, specifically distinguishing the cosmological constant indicative of a standard ΛCDM model from a dynamic model associated with a curved ΛCDM. This discrimination is facilitated by utilizing the priors of Om andΩm0 . The conditionOm=Ωm0 signifies consistency with the ΛCDM model. In contrast, situations whereOm>Ωm0 suggest a quintessence scenario, whileOm<Ωm0 points to a phantom scenario [114]. This diagnostic test not only provides a robust approach to understanding DE but also presents a unique method for distinguishing between various cosmological models. Its reliance on observational measurements, particularly the Hubble parameter, enhances its practicality and reliability in revealing the fundamental dynamics of the universe. In a flat universe, the expression for Om is defined asOm=(H(z)H0)2−1(1+z)3−1.

(22) -
The BAO scale, a fundamental length scale embedded in the large-scale structure of the universe, traces back to density fluctuations in the early cosmos, giving rise to the acoustic waves. These waves left a distinctive imprint on matter distribution as the universe transitioned to transparency. Representing the comoving distance of acoustic oscillations at around 380,000 years, the BAO scale corresponds to the sound horizon during cosmic recombination when baryons and photons decoupled. In observational terms, it acts as a standardized ruler in galaxy surveys, allowing astronomers to infer distances by measuring apparent angular sizes. This tool facilitates exploration of the universe's geometry and expansion history, contributing to our grasp of cosmological parameters and DE. Noteworthy surveys, such as the SDSS [115], have extensively studied the BAO scale, playing a crucial role in precision cosmology. The BAO scale is determined by the cosmic sound horizon which imprinted in the cosmic microwave background during the drag epoch
zd . Mathematically expressed asrd=∫∞zdcs(z)/H(z)dz , it involves the speed of soundcs defined as√δpγδρB+δργ=√(1/3)δργδρB+δργ=1√3(1+R) , where R represents the ratio of baryon to photon density. The dataset from [1] provides a redshift at the drag epoch,zd=1059.94±0.30 . In the flat ΛCDM model, [1] estimates the BAO scale,rd=147.09±0.26 Mpc, while [116] reportsrd=143.9±3.1 Mpc. Independent of CMB data, [117] reportsrd=144±5.5 Mpc. Additionally, [118] findsrd=143.7±2.7 Mpc. Moreover, a study [119] combined 2D BAO and Supernova data, yielding BAO scale values of 141.45 Mpc≤rd≤159.44 Mpc (Binning) and 143.35 Mpc≤rd≤161.59 Mpc (Gaussian). The observed discrepancy between early- and late-time measurements mirrors the Hubble constant (H0) tension. Notably, our outcomes are sensitive to priors for rd and H0, influencing values in therd−H0 plane. Exclusion of the Riess 2022 prior aligns the results with Planck and SDSS outcomes. -
The EoS parameter serves as a fundamental tool for delineating cosmic epochs and deciphering the characteristics of DE. It encapsulates a spectrum of values across different DE models. In the context where DE is represented by the cosmological constant (ΛCDM), the EoS parameter assumes a value of
ω=−1 . However, various DE models offer different values for this parameter. For instance, when the EoS parameter falls within the range−1<ω<−0.33 , it indicates a quintessential nature of DE. Conversely, ifω<−1 , it signifies a phantom character for the model. This parameter yields invaluable insights into the essence of DE and its profound influence on the evolution of the cosmos. -
In our statistical analysis, we aim to determine the most suitable cosmological model by considering both the number of free parameters and the obtained
χ2min value. We recognize that choosing among various information criteria can be a complex task, but we opt for commonly used ones. One of these criteria is the Akaike Information Criterion (AIC) [120−123], which define asAIC≡−2lnLmax+2ptot=χ2min+2ptot.

(23) Here,
ptot represents the total number of free parameters in a specific model, andLmax denotes the maximum likelihood of the considered model. Additionally, we utilize the Bayesian Information Criterion (BIC), introduced by [120, 122, 123], defined asBIC≡−2lnLmax+ptotln(Ntot).

(24) By computing the differences
△AIC and△BIC relative to the ΛCDM model under consideration, we assess the model's performance. Following the guidelines in [124], if0<|△AIC|≤2 , it suggests that the compared models are compatible. Conversely, if|△AIC|≥4 , it implies that the model with the higher AIC value is unsupported by the data. Similarly, for0<|△BIC|≤2 , the model with the higher BIC value is marginally less favored by the data. When2<|ΔBIC|≤6 (|△BIC|>6 ), the model with the higher BIC value is significantly (highly) less favored. In cosmological statistical analyses, terms such as "P-value (probability value)" [87, 88, 125] play crucial roles in evaluating the significance of observations and testing hypotheses. The P-value quantifies the evidence against a null hypothesis. It indicates the probability of observing data as extreme or more extreme than those given, assuming that the null hypothesis is true. Cosmologists use P-values to assess whether observed data align with the predictions of a particular cosmological model. A low P-value suggests data inconsistency with the model, while a high P-value indicates consistency. These statistical tools are fundamental in cosmological analyses, helping cosmologists make inferences about key parameters, such as dark matter density, dark energy properties, and the universe's geometry. They assist in determining the most suitable models for describing our universe's behavior. We provide specific distinctions among the studied cosmological models in Table 3.Model χ2tot,min 

χ2red 

Kf 

AIC Δ AIC

BIC Δ BIC

P-value ΛCDM Model 10.81 0.92 3 16.81 0 17.16 0 0.55 Wettrich Model 9.91 0.92 6 21.91 5.10 19.44 2.28 0.53 Efstathiou Model 9.72 0.91 6 21.72 4.91 19.25 2.08 0.52 Ma-Zhang Model 9.90 0.92 6 21.90 5.09 19.43 2.26 0.52 Table 3. Summary of
χ2tot,min ,χ2red , AIC,Δ AIC, BIC,Δ BIC, and P-value for ΛCDM, Wettrich, Efstathiou, and Ma-Zhang models. -
a. Cosmography Parameter In Fig. 4, we present a comparative study of the deceleration parameter (q), jerk parameter (j), and snap parameter (s) for the Wettrich, Efstathiou, and Ma-Zhang models in comparison with the ΛCDM Model, considering different cosmological epochs represented by redshift (z). We begin the discussion of the deceleration parameter (q) with the Wettrich-type model shown in Fig. 4(a). At high redshifts, both the Wettrich and ΛCDM models exhibit similar deceleration behavior. The Wettrich Model has a value of approximately
0.497 for q, while the ΛCDM model has a slightly higher value of0.498 . This suggests that both models predict a similar decelerating expansion during the early stages of the universe. As redshift approaches zero (the present-day epoch), both models show a decrease in the difference between their deceleration behavior. The Wettrich type model has a value of approximately –0.403, indicating accelerated expansion, while the ΛCDM model predicts a value of−0.402 , suggesting a slightly more significant deceleration. This implies that both models converge towards a similar deceleration behavior at the present epoch. Atz=−1 , both models converge to a de Sitter phase with a deceleration parameter ofq=−1 . This value represents a transition from decelerating to accelerating expansion, typically associated with the onset of DE domination. The similarity in this transition suggests that both models capture the expected behavior at this critical redshift. Moreover, the transitional redshiftztr where q crosses zero differs slightly between the two models. For the Wettrich type model,ztr is approximately 0.893, while for the ΛCDM model, it is approximately 0.901. This indicates that the ΛCDM model predicts a slightly earlier transition to an accelerating universe compared to the Wettrich type model. Similarly, in Figs. 4(b) and 4(c), we explore the deceleration parameter (q) for the Efstathiou and Ma-Zhang type models in comparison with the ΛCDM model. Both models exhibit behavior akin to the Wettrich type model, displaying comparable trends across various cosmological epochs. The Efstathiou and Ma-Zhang models, much like the Wettrich model, demonstrate a convergence towards the ΛCDM model at low redshifts, with slight differences in transitional redshifts (ztr ). Now, we move on to the jerk parameter (j). We initiate the discussion with the Wettrich type model, as depicted in Fig. 4(d). At high redshifts, the Wettrich type model predicts j ≈ 0.998. As redshift approaches zero (the present-day epoch), the Wettrich type model indicates j ≈ 0.978. For the future, the jerk parameter approachesj≈1 , suggesting that the universe's acceleration becomes comparable to that predicted by the ΛCDM model. It is important to note that, throughout the evolution, the jerk parameter for the ΛCDM model remains constant at 1. This indicates a compelling similarity in the acceleration behavior between the Wettrich type and ΛCDM models. Furthermore, as depicted in Fig. 4(e) and 4(f), the Efstathiou and Ma-Zhang models exhibit a similar trend to the Wettrich type model, aligning with the ΛCDM model. At high redshifts, their jerk parameters are close to unity, signifying an evolving acceleration mirroring the behavior of the ΛCDM model. This coherence implies a shared cosmological evolution among these models. Finally, moving on to the snap parameter (s), initiating with the Wettrich model (Fig. 4(g)), at high redshifts, s is approximately 3.313, decreasing tos0 ≈ 0.295 near the present day. For the future, the model converges tos≈−1 , indicating a stable, nearly flat universe. In Efstathiou's model (Fig. 4(h)), at high redshifts, s ≈ 3.423, reachings0 ≈ 0.301 at the present day. Similarly, Ma-Zhang's model (Fig. 4(i)) predicts s ≈ 3.211 at high redshifts, withs0 ≈ 0.291 for the present day. Both Efstathiou and Ma-Zhang models converge tos≈−1 for the future, akin to the Wettrich model, indicating a stable, nearly flat universe. The convergence to s = -1 indicates that the fourth derivative of the scale factor approaches a constant value.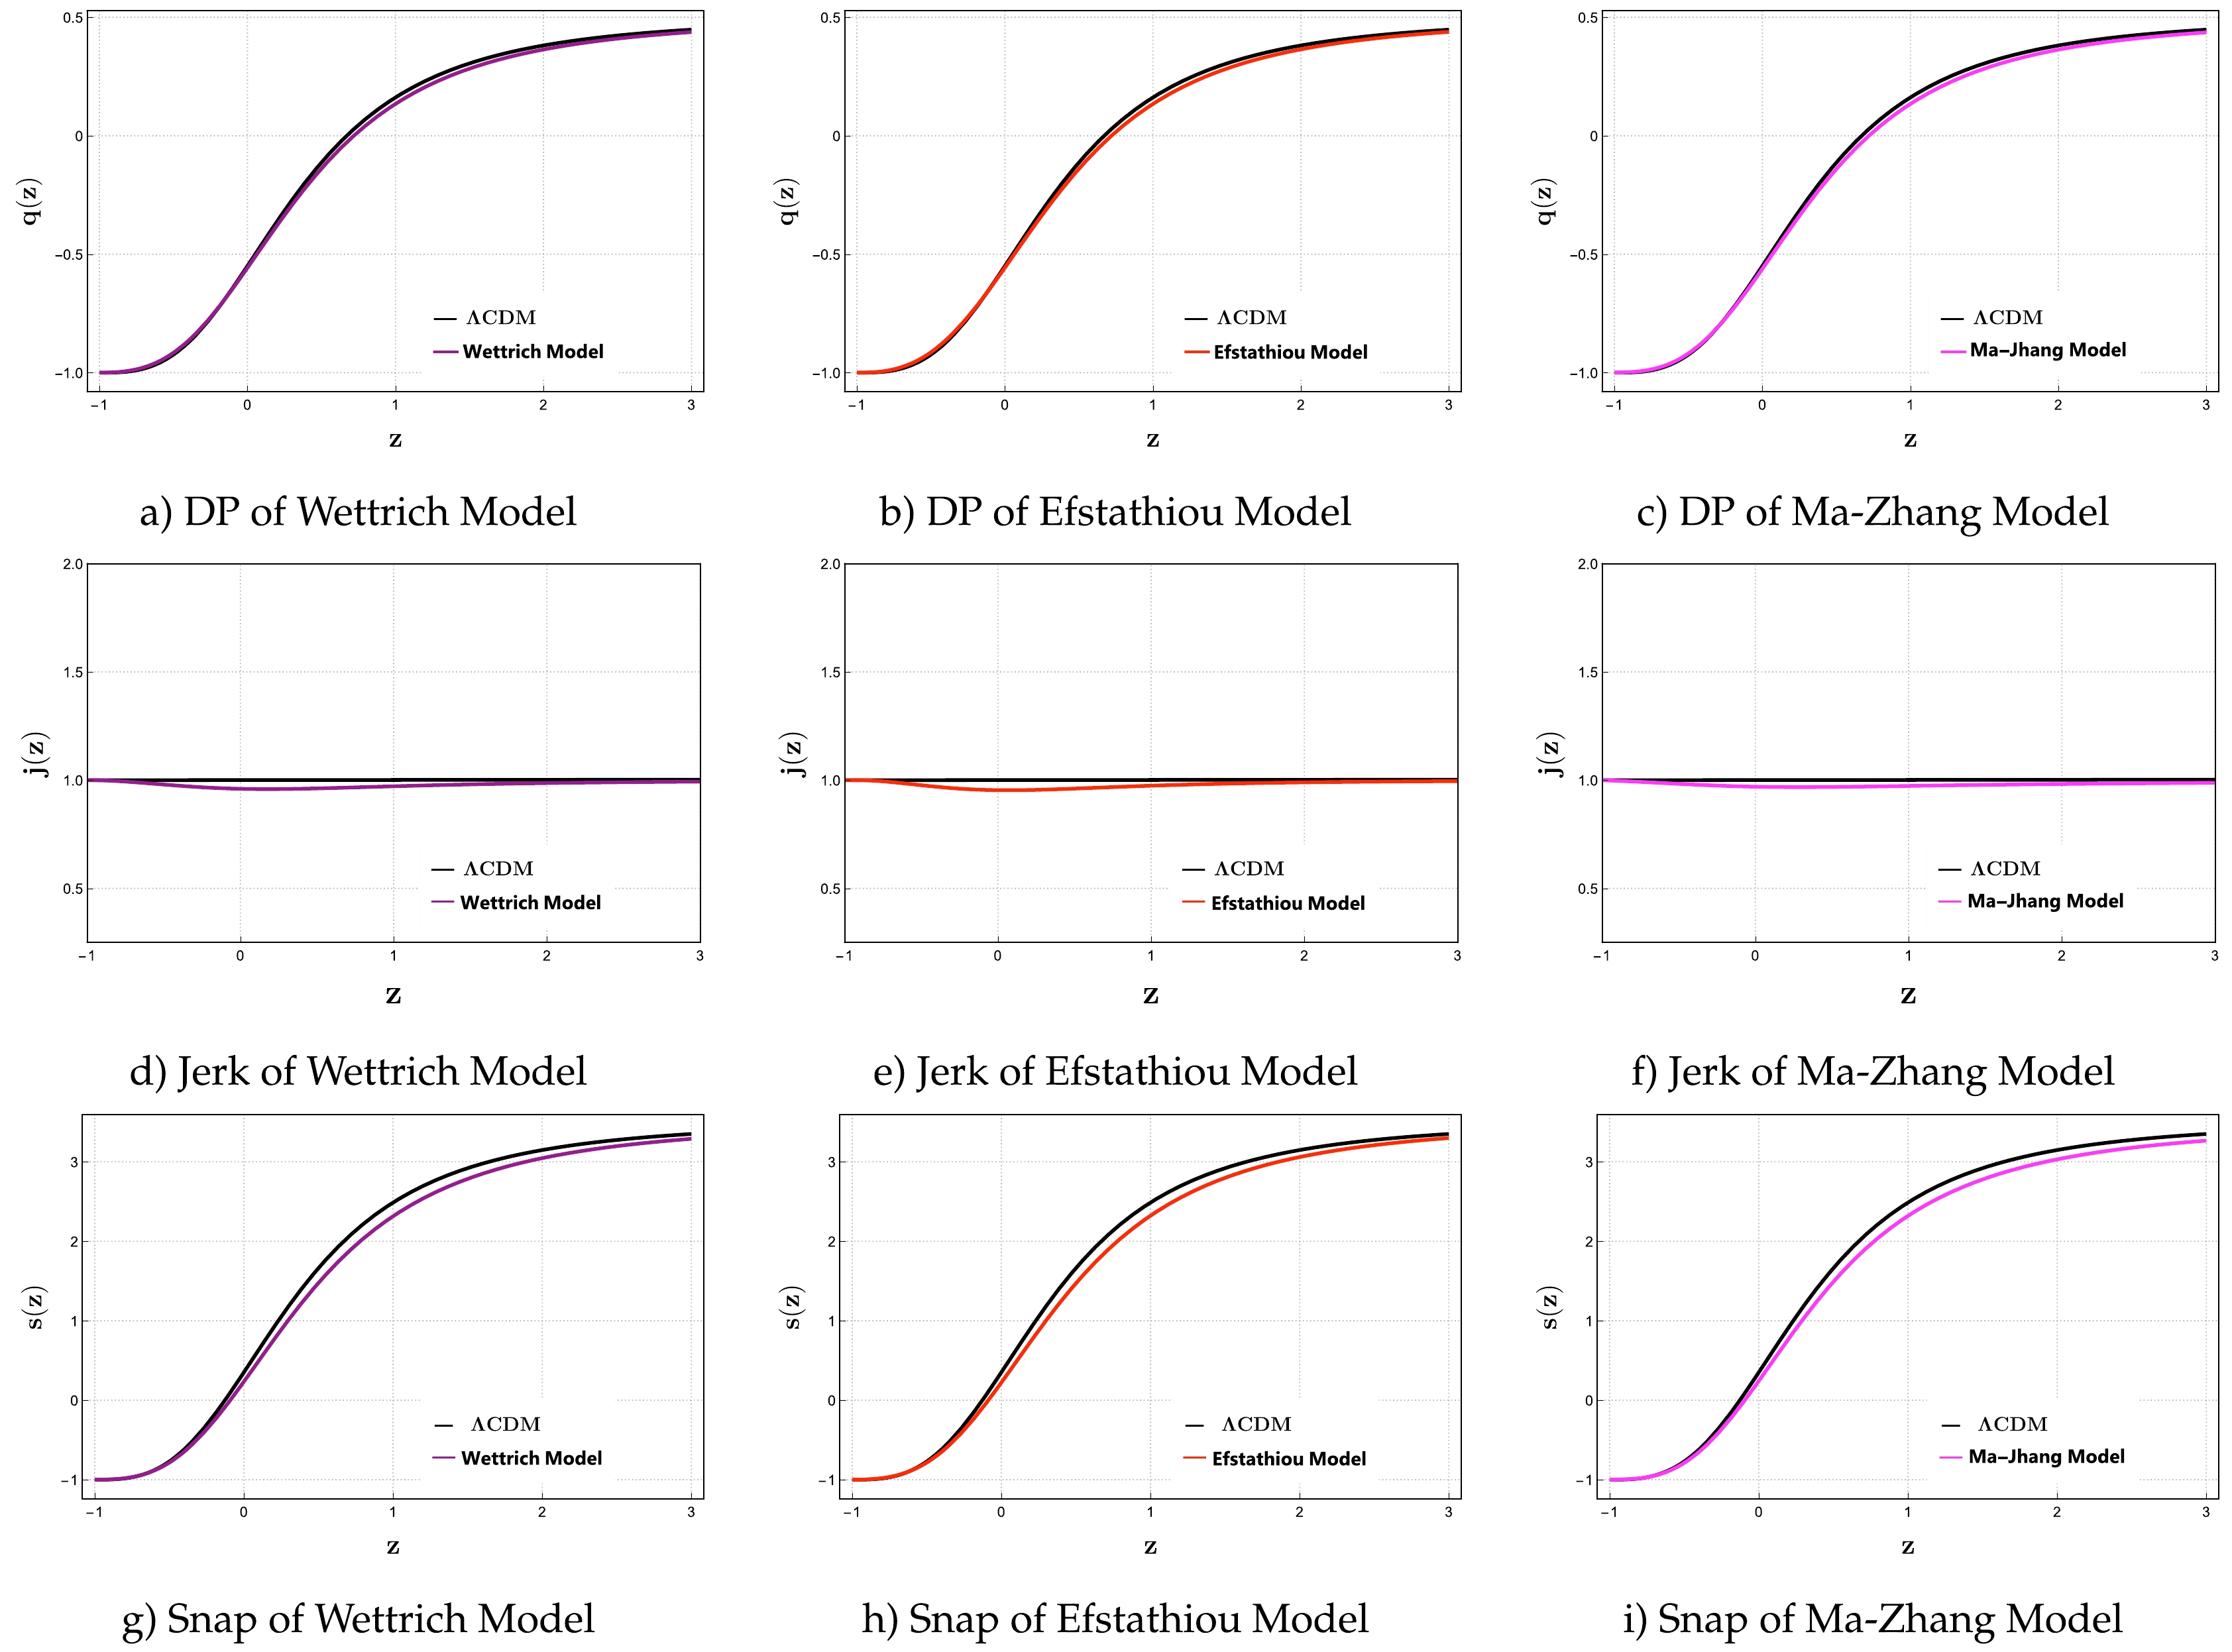
Figure 4. (color online) Variation of the cosmographic parameters as a function of the redshift z for the Wettrich, Efstathiou, and Ma-Zhang models
b. Om Diagnostic Figure 5 shows the evolution of the Om diagnostic in all three models. Figs. 5(a), 5(b), and 5(c) indicate that for the Wettrich, Efstathiou, and Ma-Zhang models, the density parameter Om is consistently less than the current matter density parameter
Ωm0 across all redshifts. This observation implies that both models fall within the phantom region, where the effective equation of state for DE,weff , is less than –1. The phantom region is associated with exotic forms of DE that violate the null energy condition, leading to unusual and accelerating expansion of the universe.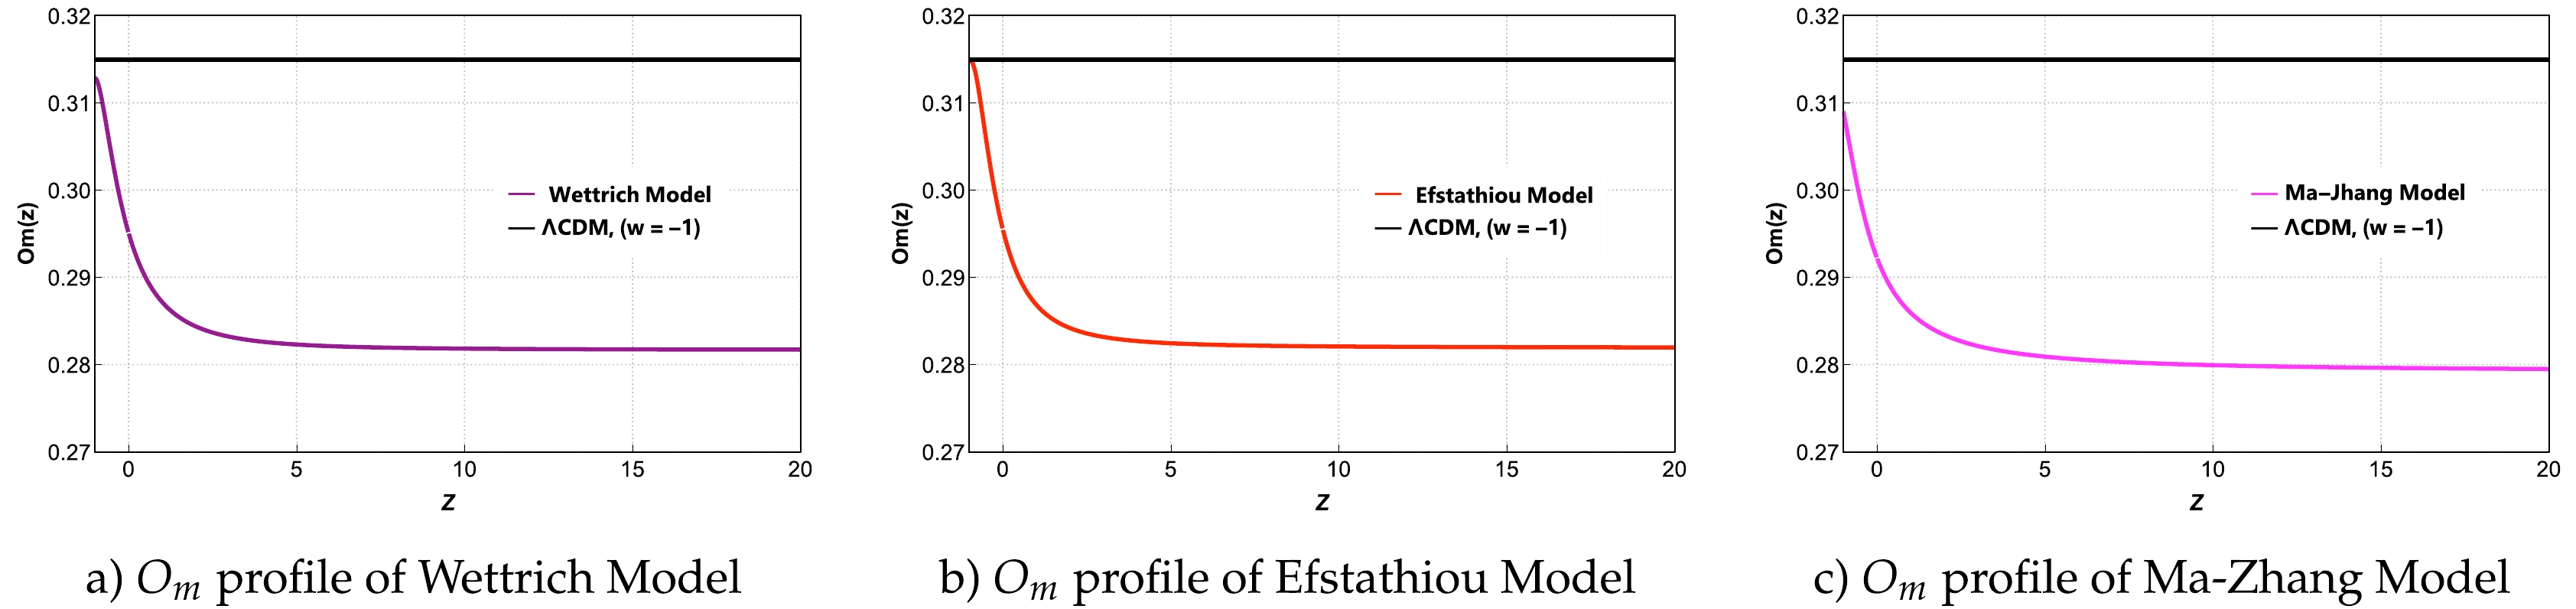
Figure 5. (color online) Evolution of the Om profile with respect to redshift for the Wettrich, Efstathiou and Ma-Zhang models.
c. rd vs H0 Contour Plane Figure 6 depicts the
rd−H0 contour plane for all three models. In the context of the Wettrich parametrization, the posterior distribution of therd−H0 contour plane is presented in Fig. 6(a). For a flat ΛCDM, the measurement results from [1] yield an estimate ofrd=147.09±0.26 Mpc. Considering the BAO Sloly, the rd value is determined to be 148.615 ± 10.29 Mpc, displaying close agreement with the Planck results. The incorporation of the R22 prior into the BAO dataset results inrd=141.207±2.74 Mpc. Although this value is in tension with the Planck estimate, it still aligns with the findings of [116]. Moving on to the Efstathiou parametrization, the posterior distribution of therd−H0 contour plane is depicted in Fig. 6(b). Considering the BAO Sloly, the determined rd value is 148.156 ± 2.76 Mpc, showing close agreement with the Planck results. The inclusion of the R22 prior into the BAO dataset yieldsrd=139.58±3.85 Mpc, aligning with the findings of [116]. Now, in the context of the Ma-Zhang parametrization, the posterior distribution of therd−H0 contour plane is presented in Fig. 6(c). Considering the BAO Sloly, the determined rd value is 147.973 ± 10.76 Mpc, which is in close agreement with the Planck results. The addition of the R22 prior into the BAO dataset results inrd=139.600±2.75 Mpc, showing agreement with [116]. In [119], it was reported that, through the utilization of Binning and Gaussian methods to merge measurements from 2DBAO and SNIa data, the absolute BAO scale values span from 141.45 Mpc tord≤159.44 Mpc (Binning) and from 143.35 Mpc tord≤161.59 Mpc (Gaussian). These results underscore a notable disparity between early- and late-time observational measurements, akin to the observed tension in H0. It is crucial to acknowledge that our findings are contingent on the chosen priors for rd and H0, exerting an influence on the estimated values within therd−H0 contour plane. An intriguing observation emerges when the R22 prior is excluded; in such cases, the results for H0 and rd tend to align more closely with the Planck and SDSS outcomes, alleviating the tension observed in the absence of this specific prior.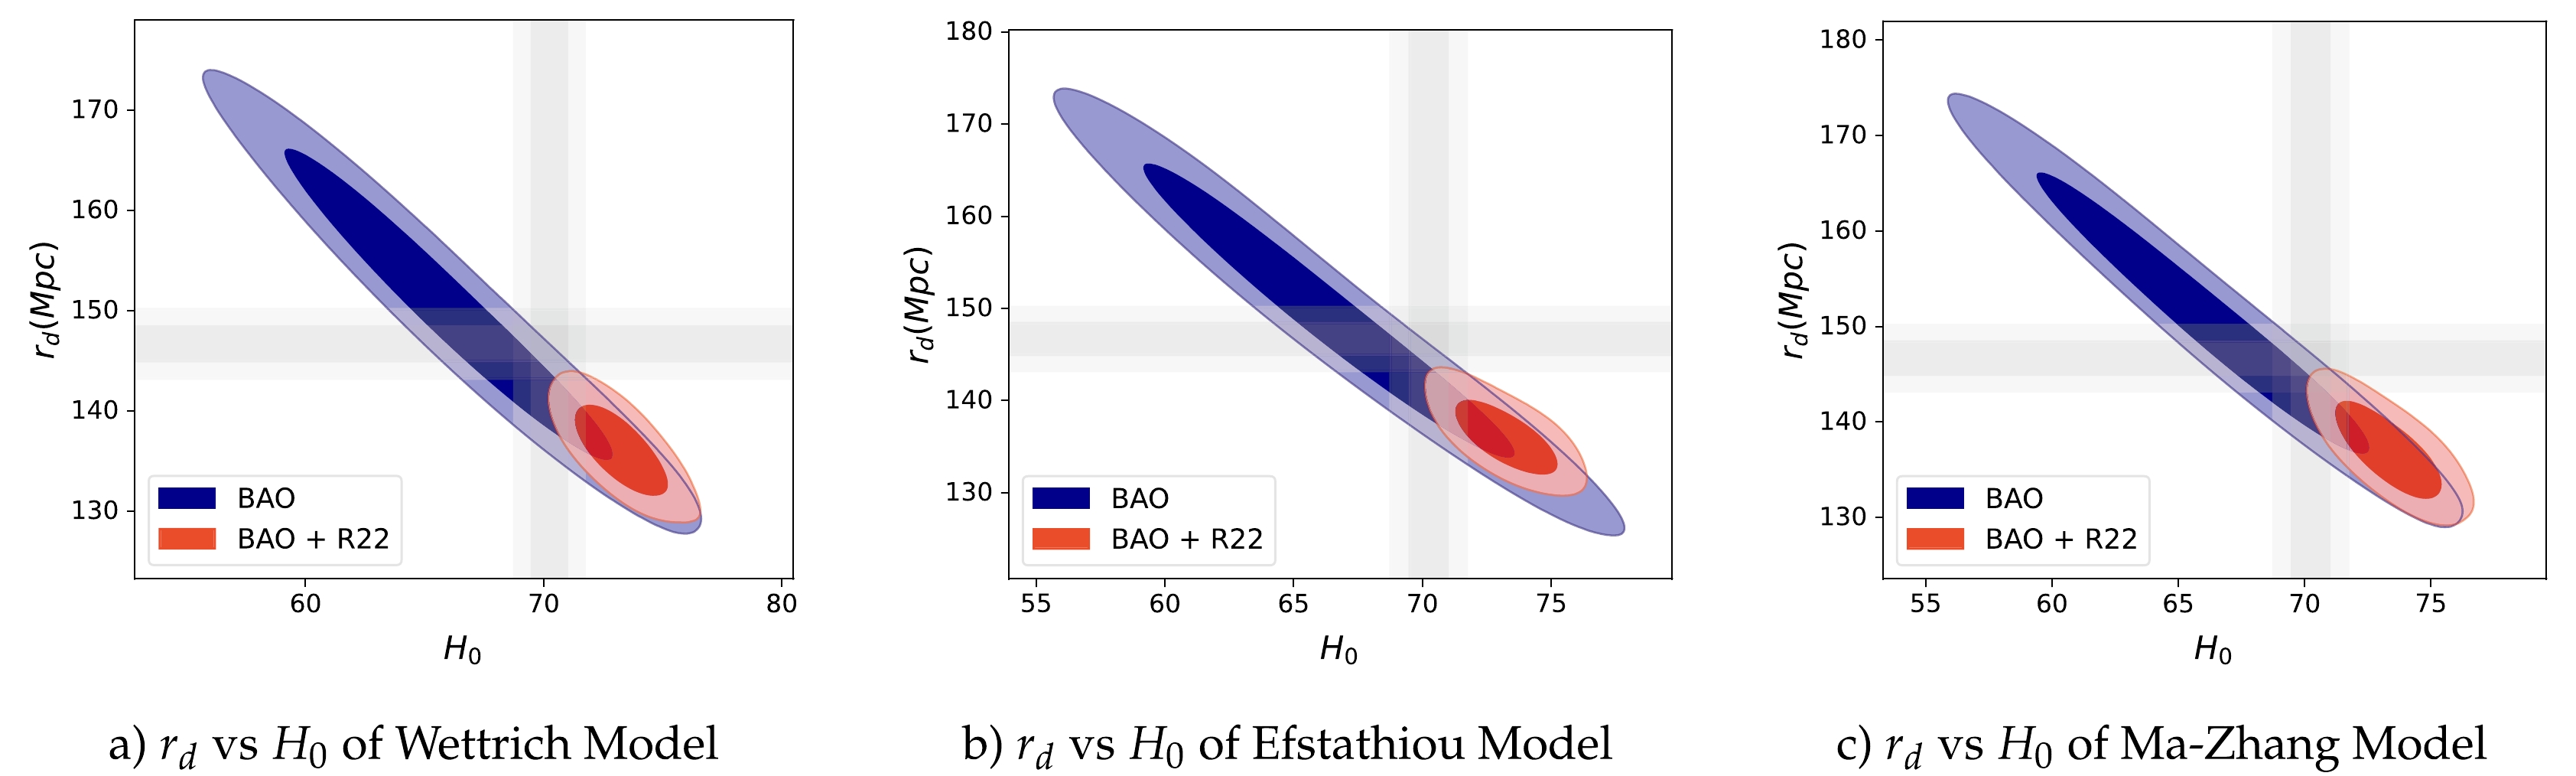
Figure 6. (color online) Posterior distribution of diverse observational data measurements within the rd vs H0 contour plane using the Wettrich, Efstathiou, and Ma-Zhang models. The shaded regions correspond to the 1
σ and 2σ confidence plane.d. EoS Parameter Figure 7 shows the evolution of the EoS parameters for three models. Figures 7(a), 7(b), and 7(c) depict the evolution for the Wettrich, Efstathiou, and Ma-Zhang models, respectively. In the Wettrich model, the present-day value of the EoS parameter is
ω0 = –0.771, and at z = –1, it isω(−1) ≈ –1.021. In the Efstathiou model,ω0 = –0.783 andω(−1) ≈ –1.001. In the Ma-Zhang model,ω0 = –0.981 andω(−1) ≈ –1.011. All models predict an EoS parameter close toω = –1, indicating a behavior similar to the cosmological constant.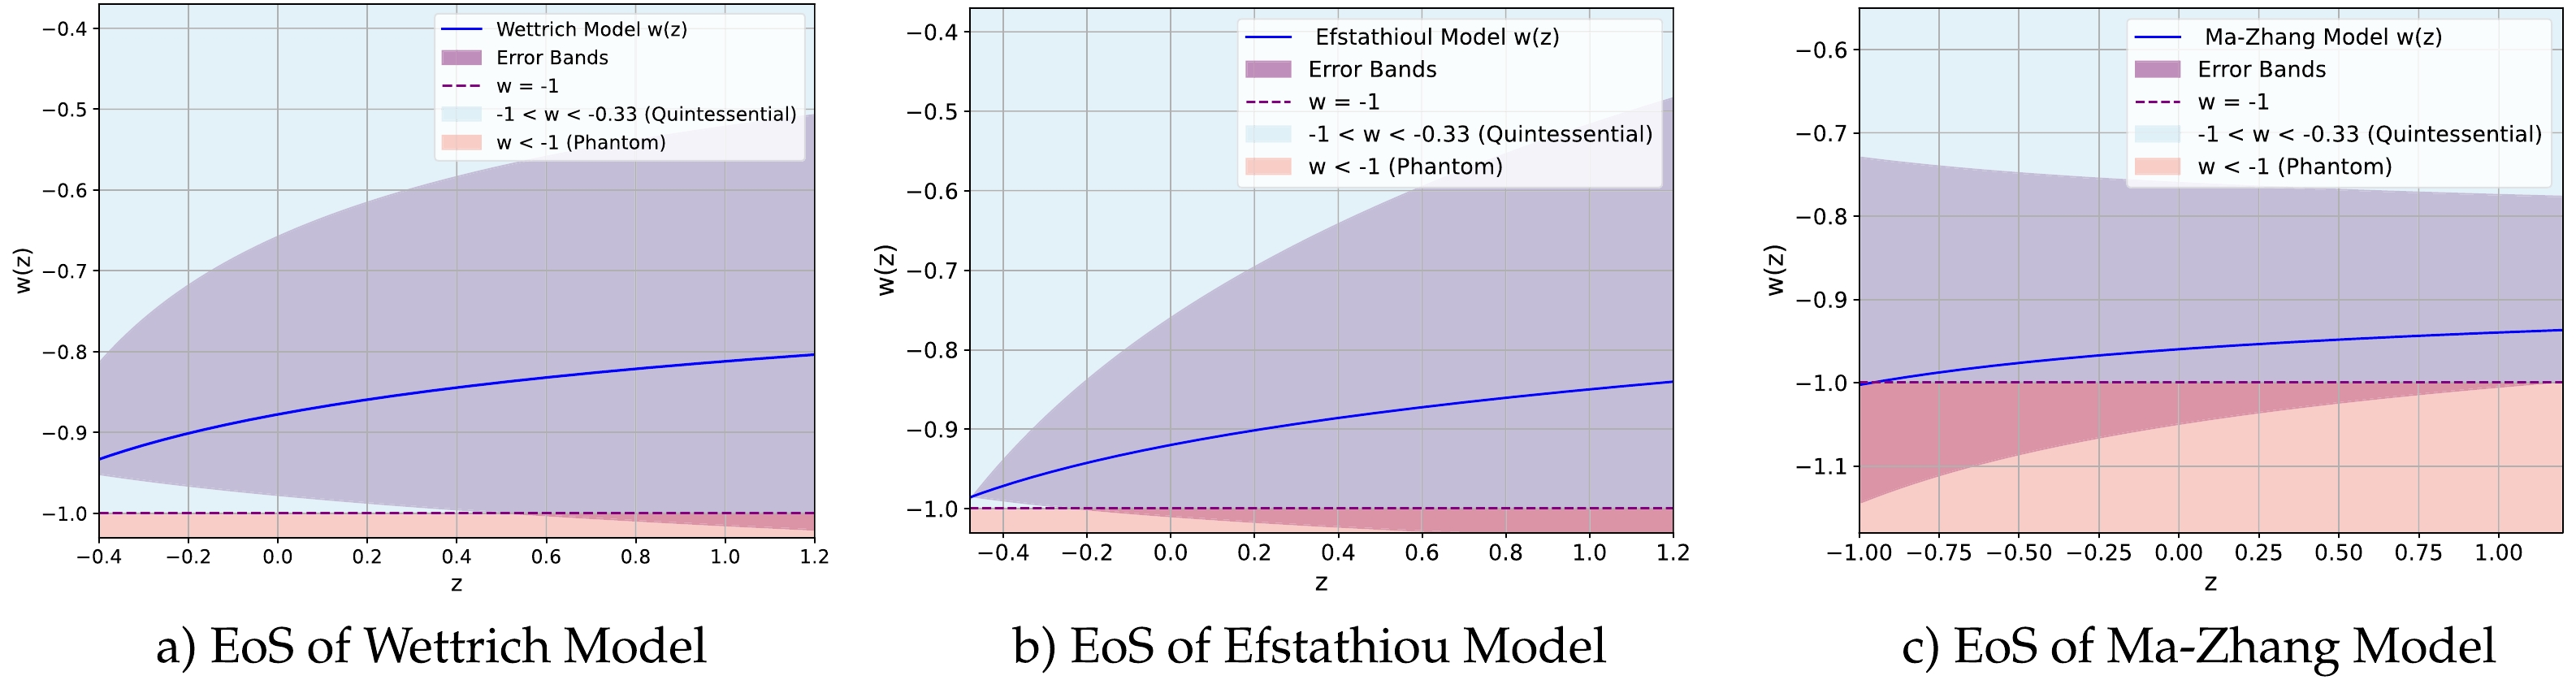
Figure 7. (color online) Evolution of the EoS profile with respect to redshift for the Wettrich, Efstathiou, and Ma-Zhang models.
e. Statistical Analysis Here, we consider the P-value and the values presented in Table 3 for
χ2tot,min ,χ2red , AIC, and BIC. Theχ2tot,min for the Wettrich model is slightly lower than that of the ΛCDM model, suggesting a marginally better fit in terms of minimizing the totalχ2 . Theχ2red values for both models are relatively close, indicating similar goodness of fit to the data. The AIC value for the Wettrich model is higher than that of the ΛCDM model, suggesting that the ΛCDM model provides a better trade-off between goodness of fit and model complexity. The calculatedΔ AIC of 5.10453 indicates that the Wettrich model is less supported compared to the ΛCDM model. This value falls within the range of models that are less supported, according to AIC. The BIC value for the Wettrich model is lower than that of the ΛCDM model, suggesting that, based on BIC, the Wettrich model might be preferred in terms of model complexity. TheΔ BIC value of 2.2825 indicates that the Wettrich model is somewhat favored over the ΛCDM model according to BIC. The P-value for both models is relatively high, with the ΛCDM model having a P-value of 0.5500 and the Wettrich model having a P-value of 0.5354. Higher P-values suggest good agreement between the model and data. Theχ2tot,min for the Efstathiou model is lower than that of the ΛCDM model, suggesting a better fit in terms of minimizing the totalχ2 . Theχ2red values for both models are close, indicating comparable goodness of fit to the data. The AIC value for the Efstathiou model is higher than that of the ΛCDM model, indicating that the ΛCDM model provides a better trade-off between goodness of fit and model complexity. The calculatedΔ AIC of 4.9116 indicates that the Efstathiou model is less supported compared to the ΛCDM model. This value falls within the range of models that are less supported, according to AIC. The BIC value for the Efstathiou model is lower than that of the ΛCDM model, suggesting that, based on BIC, the Efstathiou model might be preferred in terms of model complexity. TheΔ BIC value of 2.0896 indicates that the Efstathiou model is somewhat favored over the ΛCDM model according to BIC. The P-value for both models is relatively high, with the ΛCDM model having a P-value of 0.5500 and the Efstathiou model having a P-value of 0.5234. Higher P-values suggest good agreement between the model and data. Theχ2tot,min for the Ma-Zhang model is slightly lower than that of the ΛCDM model, suggesting a slightly better fit in terms of minimizing the totalχ2 . Theχ2red values for both models are close, indicating comparable goodness of fit to the data. The AIC value for the Ma-Zhang model is higher than that of the ΛCDM model, indicating that the ΛCDM model provides a better trade-off between goodness of fit and model complexity. The calculatedΔ AIC of 5.09115 indicates that the Ma-Zhang model is less supported compared to the ΛCDM model. This value falls within the range of models that are less supported, according to AIC. The BIC value for the Ma-Zhang model is lower than that of the ΛCDM model, suggesting that, based on BIC, the Ma-Zhang model might be preferred in terms of model complexity. TheΔ BIC value of 2.2692 indicates that the Ma-Zhang model is somewhat favored over the ΛCDM model according to BIC. The P-value for both models is relatively high, with the ΛCDM model having a P-value of 0.5500 and the Ma-Zhang model having a P-value of 0.5213. Higher P-values suggest good agreement between the model and data. -
Our investigation explored accelerated cosmic expansion in the late universe using the Wettrich, Efstathiou, and Ma-Zhang parametrizations within HLG. Analyzing 24 uncorrelated BAO measurements from recent galaxy surveys (redshift range:
z=0.106 toz=2.33 ) alongside the latest Hubble constant measurement (R22), we derived best-fit values for model parameters. Comparing these models with the standard ΛCDM model offers insights into their behavior across cosmological epochs. All three models show similar trends to ΛCDM regarding the deceleration parameter (q), suggesting a consistent description of early universe expansion. As redshift approaches zero, the Wettrich and ΛCDM models converge towards comparable deceleration behaviors, albeit with slightly different transitional redshifts (ztr ), indicating nuanced distinctions in predictions. Analysis of the jerk parameter (j) demonstrates alignment with ΛCDM, implying shared acceleration behavior among all models. Snap parameter (s) analysis reveals consistent patterns, suggesting a stable, nearly flat universe for all models, akin to the behavior of the Wettrich type. Examination of the Om diagnostic consistently places all models within the phantom region, suggesting exotic forms of DE driving an unusual and accelerating expansion of the universe. All three models—Wettrich, Efstathiou, and Ma-Zhang—predict an EoS parameter close toω=−1 , suggesting behavior similar to that of a cosmological constant.The comparison of statistical criteria, including
χ2tot,min ,χ2red , AIC, BIC, P-value, and L-statistic, offers insights into how the Wettrich, Efstathiou, and Ma-Zhang models compare to the standard ΛCDM model. While Wettrich and Ma-Zhang showed slightly improved fits in terms ofχ2tot,min , the ΛCDM model exhibited a superior balance between goodness of fit and model complexity, reflected in lower AIC andΔ AIC values. Despite some advantages shown by Wettrich and Efstathiou in specific metrics, the overall consensus favors the classical ΛCDM model as the preferred choice. Nuanced differences in BIC values suggest a context-dependent consideration. When comparing the Wettrich, Efstathiou, and Ma-Zhang models, both the Wettrich and Efstathiou models exhibit a more favorable trade-off, albeit with some variation in BIC values.Our investigation of the Wettrich, Efstathiou, and Ma-Zhang parametrizations reveals intriguing insights into the
rd−H0 contour planes. Despite tension with the Planck estimate, the Wettrich parametrization aligns with [116], indicating nuanced agreement. The Efstathiou parametrization shows close agreement with Planck results and [116], highlighting the robustness of our analyses. Similarly, the Ma-Zhang parametrization exhibits agreement with Planck results and [116], emphasizing the reliability of our methodology. The study reported in [119] on the absolute BAO scale using Binning and Gaussian methods revealed a significant discrepancy between early- and late-time observational measurements, akin to the tension in H0. This underscores the complexities in reconciling different datasets. Our results emphasize the influence of chosen priors onrd−H0 contour plane estimates. The inclusion of the R22 prior appears to mitigate tension and align our findings more closely with Planck and SDSS outcomes, prompting further consideration of priors in cosmological analyses. In light of these findings, our study contributes to the ongoing dialogue surrounding the interplay of different parametrizations, observational datasets, and priors in cosmological investigations. The observed nuanced agreements and tensions underscore the need for continued refinement and scrutiny of cosmological models to enhance our understanding of the fundamental parameters governing the evolution of the universe. -
G. Mustafa is very thankful to Prof. Gao Xianlong from the Department of Physics, Zhejiang Normal University, for his kind support and help during this research.
Cosmological test of dark energy parametrizations within the framework of Horava-Lifshitz gravity via baryon acoustic oscillation
- Received Date: 2024-06-09
- Available Online: 2024-11-15
Abstract: We conduct an investigation to explore late-time cosmic acceleration through various dark energy parametrizations (Wettrich, Efstathiou, and Ma-Zhang) within the Horava-Lifshitz gravity framework. As an alternative to general relativity, this theory introduces anisotropic scaling at ultraviolet scales. Our primary objective is to constrain the key cosmic parameters and baryon acoustic oscillation (BAO) scale, specifically the sound horizon (rd), by utilizing 24 uncorrelated measurements of BAOs derived from recent galaxy surveys spanning a redshift range from z = 0.106 to z = 2.33. Additionally, we integrate the most recent Hubble constant measurement by Riess in 2022 (denoted as R22) as an extra prior. For the parametrizations of Wettrich, Efstathiou, and Ma-Zhang, our analysis of BAO data yields sound horizon results of rd = 148.1560 ± 2.7688 Mpc, rd = 148.6168 ± 10.2469 Mpc, and rd = 147.9737 ± 10.6096 Mpc, respectively. Incorporating the R22 prior into the BAO dataset results in rd = 139.5806 ± 3.8522 Mpc, rd = 139.728025 ± 2.7858 Mpc, and rd = 139.6001 ± 2.7441 Mpc. These outcomes highlight a distinct inconsistency between early and late observational measurements, analogous to the H0 tension. A notable observation is that, when we do not include the R22 prior, the outcomes for rd tend to be in agreement with Planck and SDSS results. Following this, we conducted a cosmography test and comparative study of each parametrization within the Lambda Cold Dark Matter paradigm. Our diagnostic analyses demonstrate that all models fit seamlessly within the phantom region. All dark energy parametrizations predict an equation of state parameter close to


 DownLoad: