


 Abstract
 HTML
HTML Reference
 Related
 PDF
PDF


-
The collision of relativistic heavy nuclei results in a highly unstable, transient state of matter known as Quark Gluon Plasma (QGP), which exists for a short time. Specifically, QGP refers to a strongly interactive state of matter [1−4] where quarks and gluons are asymptotically free, which is a peculiar behavior. The temperature and energy density of QGP is as high as those of the early universe; owing to this resemblance, QGP constitutes a prominent research topic in high-energy physics, and many collaborations around the globe are working on QGP to explore the conditions of the early universe. The existence of QGP has been confirmed through collisions of heavy nuclei such as Pb-Pb and Au-Au. In addition, many signatures of QGP have been observed in p-p collisions. These collisions mainly provide baselines for heavy-ion collisions. These signatures of QGP may include strangeness enhancement,
$ J/\psi $ melting or suppression, and jet quenching. [5−8].We used p-p collisions as references to study the collision mechanism of heavy nuclei at colliders. Recent results obtained from p-p and proton-lead (p-Pb) collisions have shown similar trends to that of Pb-Pb collisions. For instance, spectra of
$ p_T $ as a function of transverse mass$ m_T $ have shown the same excitation function with charged hadron multiplicity as that exhibited by larger colliding systems. The analyses of the$ p_T $ distribution in p-p collisions show a clear hardening of the$ p_T $ spectra from multiplicity class-X to class-I, where the average charged particle densities in class-X are lowest while the charged particle densities in class-I are highest, which is the same trend observed in collisions of larger systems [9]. Additionally, it has been found that, in contrast to pions, the event charged-particle multiplicity increases with the integrated yields of strange and multi-strange hadrons [10]. This strangeness enhancement has already been reported for Pb-Pb collisions.QGP behaves like a hot fluid that expands and cools down; during its evolution, it passes through many stages, and each stage has its corresponding temperature. The chemical freeze-out temperature corresponds to the chemical freeze-out stage where inelastic collisions among the constituents of the fireball vanish, which results in the stoppage of production of new particles. The underlying reason is that when the fireball expands owing to a pressure gradient, the inter-particle distances at a certain point become so large that the constituents of the fireball cannot interact inelastically [11−13]. The thermal freeze-out stage corresponds to the kinetic or thermal freeze-out temperature, where elastic collisions between the generated particles also come to an end [14−16]. After the thermal freeze-out stage, the particles move outward, where they may be detected by the detectors, and the particles at the detectors have the same energy and momentum spectra or distribution as they have at the thermal freeze-out stage. This implies that very accurate information about the thermal or kinetic freeze-out stage can be obtained by studying the
$ p_T $ spectra of the outgoing particles. The information about the freeze-out stage may include the thermal freeze-out temperature, radial or transverse flow velocity of the outgoing particles, volume of the created system (V) after the collision, and number of particles created or the multiplicity parameter ($ N_0 $ ).The detectors cannot measure the aforementioned freeze-out parameters; therefore, many hydrodynamical and statistical models are used to extract the values of these valuable parameters, which help understand the true nature of QGP. Even after the interactions between particles stop during the evolution of the fireball, the particles still occupy space according to a statistical distribution [17]. The models used for the analysis in the present study and those commonly used are briefly discussed in this paper. The use of non-extensive statistical distributions to analyze the
$ p_T $ spectra in high-energy collisions is popular and convenient. In previous studies, a variety of Tsallis distributions have been used to effectively explain the$ p_T $ spectra of produced particles in p-p interactions at RHIC and LHC energies [18−23]. The most relevant aspect about using the Tsallis distribution is that it only depends on three parameters, which help fit the experimental data: the first parameter is the effective temperature (T), which includes both thermal and flow effects of the fireball; the second parameter is the non-extensive variable (q), which measures the deviation from the extensive Boltzmann-Gibbs statistics; and the third parameter is the fitting or normalization constant ($ N_0 $ ). These three parameters can be incorporated to calculate the volume and initial conditions of the system, for example, the initial temperature [24]. To analyze the$ p_T $ distributions of the outgoing particles in high energy nuclei collisions at the LHC and RHIC, various flow models are incorporated into Tsallis statistics. To extract the radial flow velocity and kinetic freeze-out temperature, the Hagedorn formula with embedded transverse flow [25−28], Blast-Wave model with Tsallis statistics (TBW model) [29, 30], Blast-Wave model with Boltzmann Gibbs statistics (BGBW model) [31, 32] and Tsallis distribution with flow effect or improved Tsallis distribution [33−35] have mainly been used in previous studies.The rest of the paper is structured as follows. The "Methodology" section elucidates the statistical models utilized in our analyses. Subsequently, the "Results and Discussion" section presents our findings in detail and provides suitable explanations. Finally, the "Conclusion" section encapsulates the outcomes and deductions drawn from our research.
-
Experimental
$ p_T $ distributions for identified light and strange particles in$ \sqrt{s} $ = 7 TeV p-p collisions were reported in [9] and [10], respectively. The$ p_T $ distributions of particles have a lot of information about the freeze-out stage of QGP. Therefore, these distributions are significant for the extraction of these pieces of information (parameters). Various statistical and hydrodynamical models are used to extract these parameters from$ p_T $ distributions, as described in the "Introduction" section. In the present study, two models, namely the Tsallis and Hagedorn models, were used. The classical exponential function called Boltzmann Gibbs function, given in Eq. (1), is only suitable for low$ p_T $ regions. For high$ p_T $ regions, a power law distribution is more appropriate. The Tsallis function, given in Eq. (2), is one of such power law distribution functions that covers a wide range of$ p_T $ .$ f(E) \propto {\rm exp} \left(-\frac{E-\mu}{T}\right), $

(1) $ \frac{{\rm d}^2N}{\ N_{\rm evt}\ {\rm d}p_T\ {\rm d}y}=2\ \pi\ C\ p_T \bigg[1+\frac{(q-1)}{T}m_T\bigg]^{-\frac{1}{(q-1)}}, $

(2) In Eq. (2), N,
$N_{\rm evt}$ , and$ p_T $ represent the number of particles produced in the collision, number of participating particles taking part in the collision, and transverse momentum, respectively [36]; T denotes the effective temperature, encompassing both the thermal and flow effects within the evolving system. The non-extensivity parameter is denoted as q, and C represents the fitting constant, which is directly related to the size or volume of the created system according to the equation$ C=\dfrac{g V}{(2 \pi)^3} $ , where V denotes the volume of the system, and g is the degeneracy factor with varying values for different particles [37−39]. The transverse mass of the outgoing particle is represented by$ m_T $ , calculated using the formula$ m_T= \sqrt{{p_T}^2- {m_0}^2} $ , where$ m_0 $ corresponds to the rest mass of the produced particle. The Tsallis distribution function was employed in previous studies in various manners; the most consistent form in thermodynamic terms is as follows:$ \frac{{\rm d}^2N}{\ N_{\rm evt}\ {\rm d}p_T\ {\rm d}y}=2\ \pi\ C\ p_T\ m_T \bigg[1+\frac{(q-1)}{T}m_T\bigg]^{-\frac{q}{(q-1)}}. $

(3) It is important to note that the Tsallis model presented in Eq. (2) and Eq. (3) provides insights into the parameter T. However, it does not offer information about
$ T_0 $ and$ \beta_T $ . In order to extract these two parameters, we employed the Hagedorn model, which incorporates$ \beta_T $ . The functional expression for this model is expressed in a simplified form as follows:$ \frac{{\rm d}^2N}{\ N_{\rm evt}\ {\rm d}p_T\ {\rm d}y}=2\ \pi\ C \ p_T \bigg[1+\frac{m_T}{nT_0}\bigg]^{-n}, $

(4) where
$ T_0 $ is the thermal freeze-out temperature, and n is the entropy parameter. To have a contribution from the transverse flow velocity ($ \beta_T $ ), we must replace$ m_T $ by$ <\gamma_T> (m_T - P_T <\beta_T>) $ in Eq. (4) [40], where$ <\gamma_T> $ is a Lorentz factor. Eq. (5) is the simplest form of the Hagedorn model with embedded$ \beta_T $ :$ \frac{{\rm d}^2N}{\ N_{\rm evt}\ {\rm d}p_T\ {\rm d}y}=2\ \pi\ C \ p_T \bigg[1+\frac{<\gamma_T> (m_T - P_T <\beta_T>)}{nT_0}\bigg]^{-n}. $

(5) It is important to mention that, in this analysis, we used the minimum
$ \chi^2 $ method to fit the theoretical model functions on the experimental transverse momentum spectra of particles. The minimum$ \chi^2 $ method considers combined statistical and systematic errors added in quadrature. -
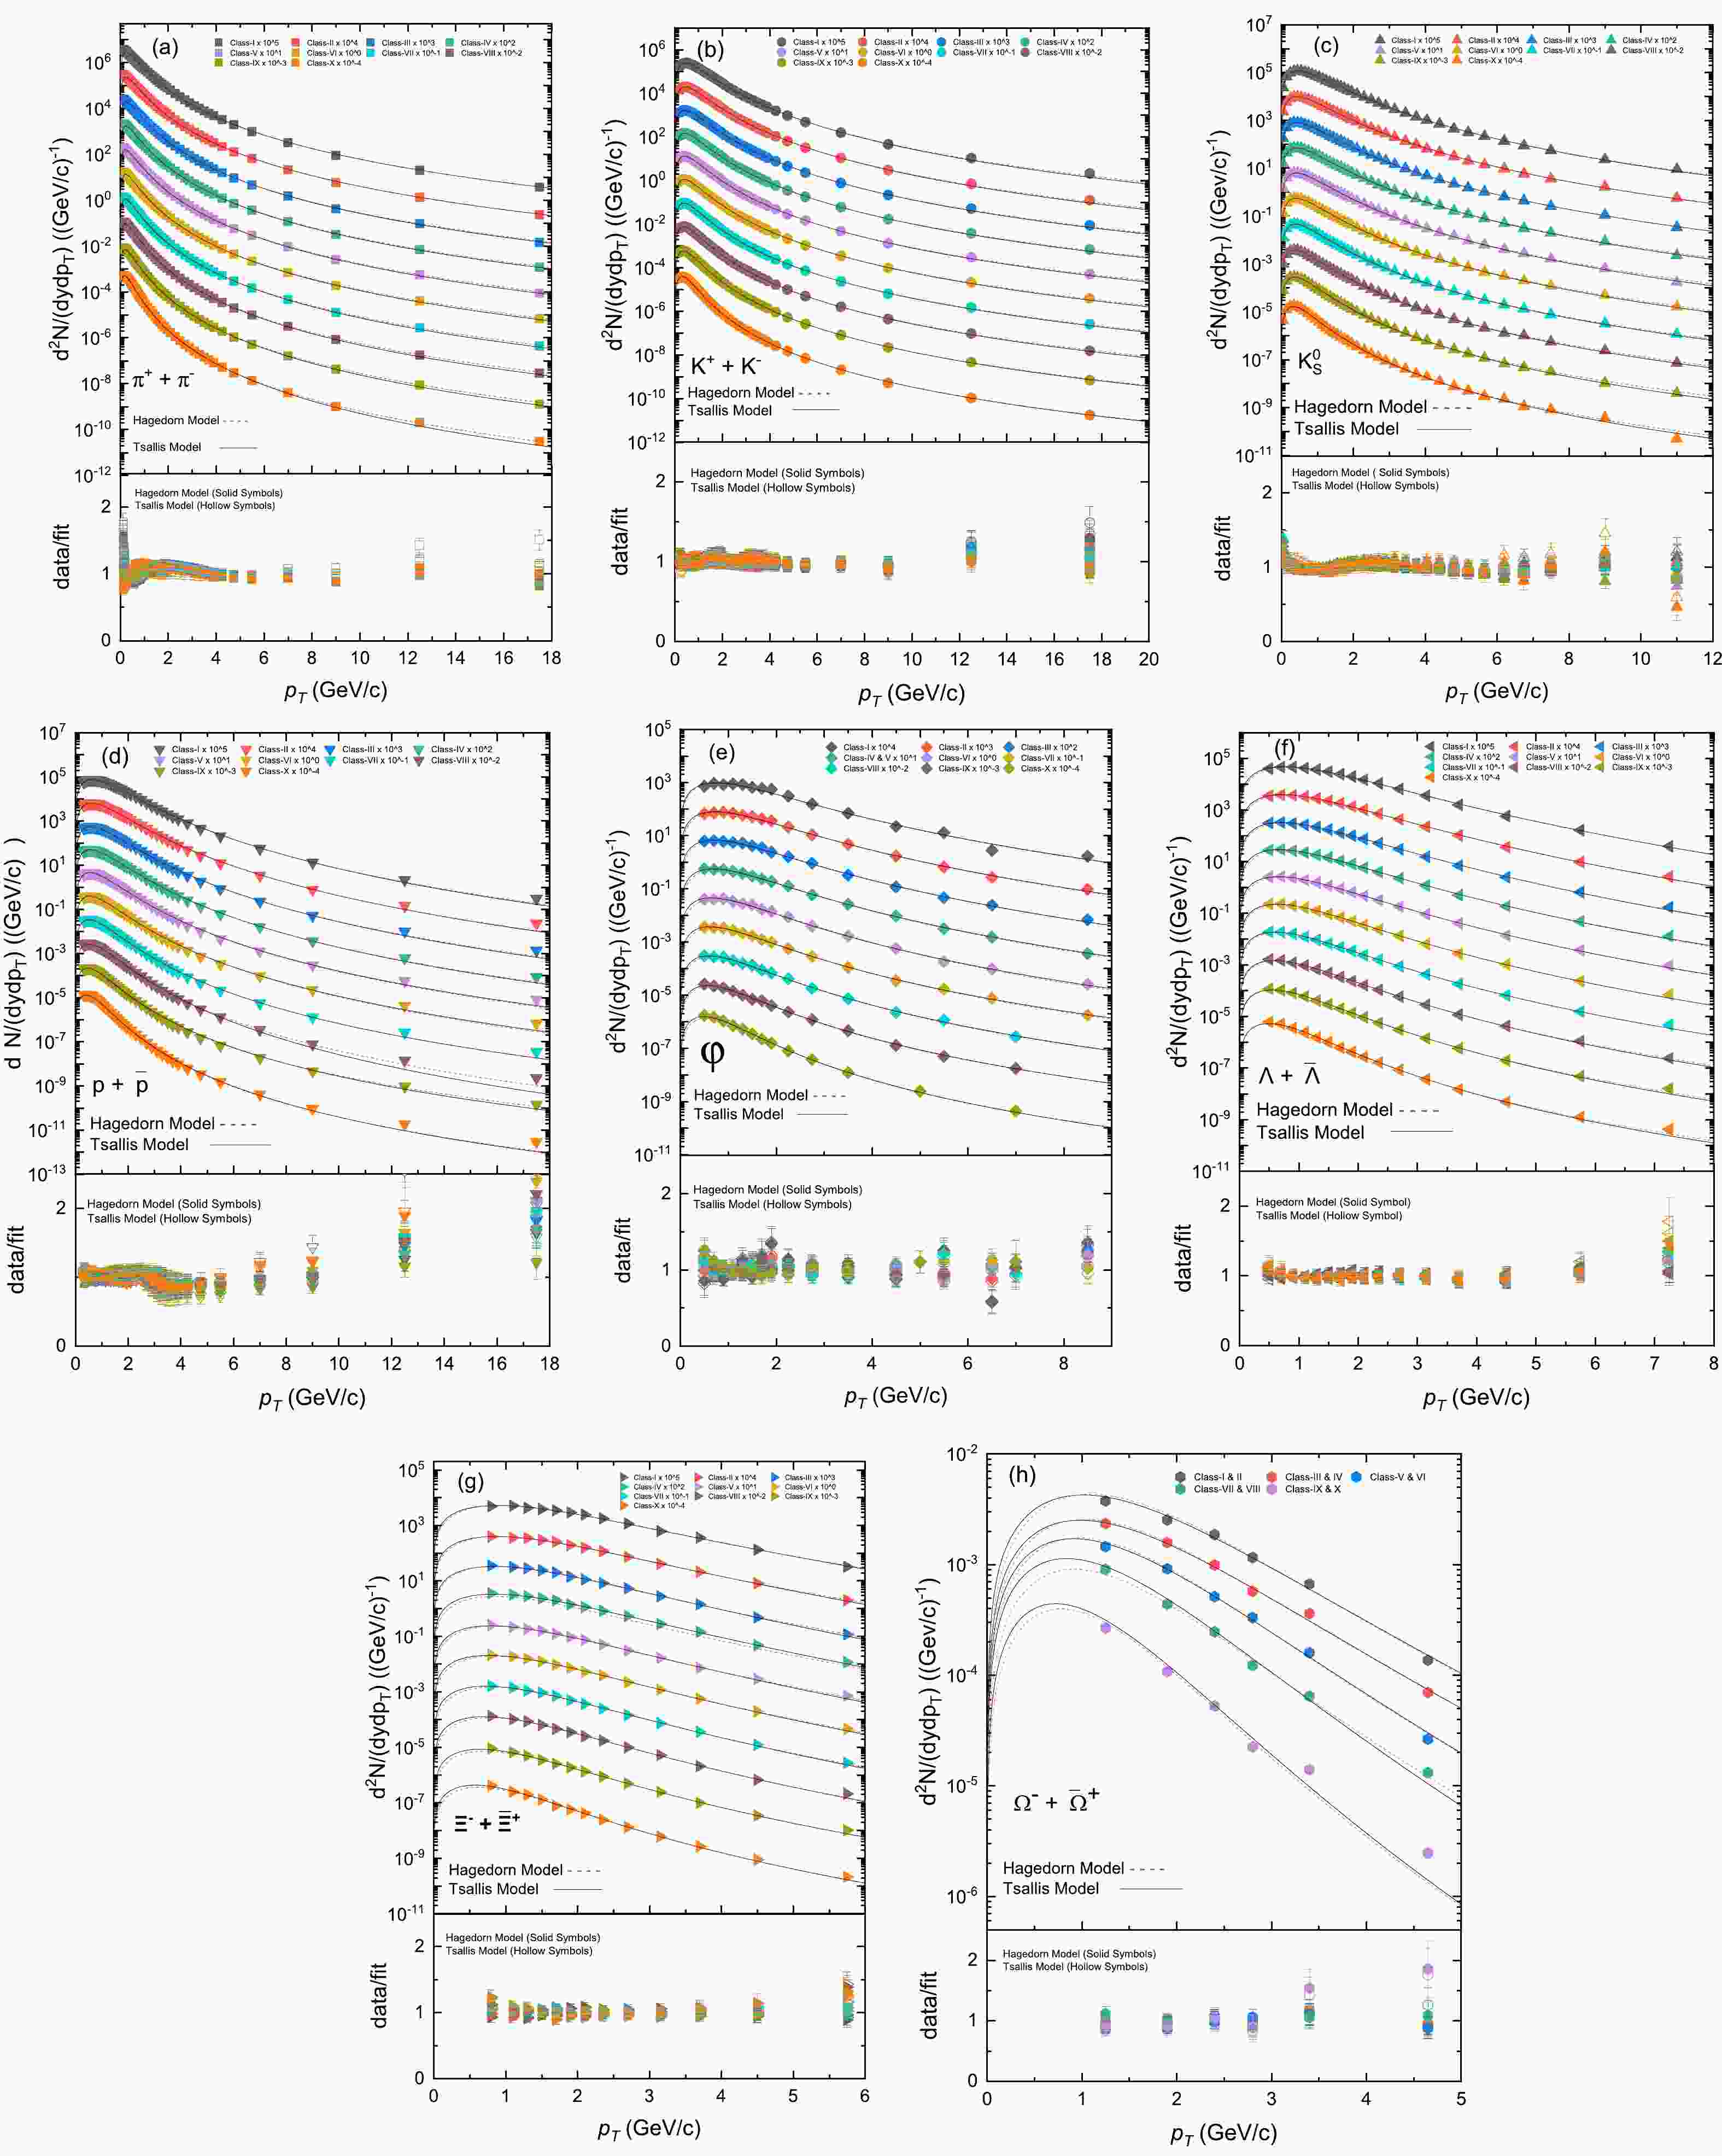
Figures 1(a)−1(h) show the transverse momentum distribution,
${{\rm d}2N}/({\ N_{\rm evt}\ {\rm d}p_T\ {\rm d}y})$ , for various light-flavored identified and strange hadrons in 7 TeV p-p collisions categorized into various multiplicity classes. Each plot represents the$ p_T $ distribution for a specific particle type, including$ \pi^++\pi^- $ ,$ K^++K^- $ ,$ K_s^0 $ ,$ p+\bar p $ , ϕ,$ \Lambda+\bar\Lambda $ ,$ \Xi^-+\bar\Xi^+ $ , and$ \Omega^-+\bar\Omega^+ $ . Within each plot, different colors correspond to different multiplicity classes in the experimental data, while distinct symbols across Figs. 1(a)−1(h) are used for different particle species. Overlaid on these data points, solid and dotted curves depict the fit outcomes derived using the Tsallis distribution (Eq. (3)) and the Modified Hagedorn model with incorporated flow (Eq. (5)), respectively. In some cases, scaling factors are applied to certain spectra to prevent curve and data point overlap within a single plot. These scaling factors are specified alongside each multiplicity class at the upper portion of each plot. During the fitting process, efforts were made to minimize the$ \chi^2 $ value for each fit, aiming to achieve high-quality fitting and hence accurate parameter extraction. The parameters extracted by the Tsallis and Hagedorn models are listed in Tables 1 and 2, respectively. The constant "C" in Eqs. (2) to (5) serves as a normalization constant that ensures that the integral of the functions in these equations evaluates to unity; "$ N_0 $ " is another normalization constant in Tables 1 and 2, used for comparing the function or model against experimental data. Despite the possibility of absorbing C into$ N_0 $ , both constants retain distinct purposes. The presence of both C and$ N_0 $ allows for precise descriptions within the context of the study.
Figure 1. (color online)
$ p_T $ spectra of the double differential yield of various light-flavored and strange hadrons at a center-of-mass energy of 7 TeV. These spectra were analyzed using both the Tsallis and Hagedorn models, with the results depicted using solid and dotted lines, respectively. The experimental data points are illustrated using diverse colors and shapes. These analyses were conducted across various multiplicity classes.Energy Particle Multiplicity Class T/MeV q $ N_0 $ 

$ \chi^2 $ 

NDF I 97.900 ± 2.937 1.159 ± 0.035 295.400 ± 8.862 3.485 46 II 93.200 ± 2.796 1.159 ± 0.035 232.400 ± 6.972 3.553 46 III 93.200 ± 2.796 1.156 ± 0.035 189.000 ± 5.67 3.401 46 IV 90.100 ± 2.703 1.156 ± 0.035 163.000 ± 4.89 2.943 46 7 TeV $ \pi^+ + \pi^- $ 

V 88.500 ± 2.655 1.155 ± 0.035 144.500 ± 4.335 2.682 46 VI 86.600 ± 2.598 1.154 ± 0.035 123.600 ± 3.708 2.304 46 VII 83.600 ± 2.508 1.153 ± 0.035 98.800 ± 2.964 1.727 46 VIII 80.400 ± 2.412 1.152 ± 0.035 81.400 ± 2.442 1.135 46 IX 77.700 ± 2.331 1.149 ± 0.034 58.900 ± 1.767 0.597 46 X 68.870 ± 2.066 1.142 ± 0.034 37.600 ± 1.128 0.425 46 I 144.380 ± 4.331 1.145 ± 0.034 43.410 ± 1.302 18.52 41 II 133.500 ± 4.005 1.146 ± 0.034 33.600 ± 1.008 13.517 41 III 123.550 ± 3.707 1.149 ± 0.034 27.200 ± 0.816 12.965 41 IV 116.520 ± 3.496 1.15 ± 0.035 23.160 ± 0.695 10.179 41 7 TeV $ K^+ + K^- $ 

V 111.940 ± 3.358 1.151 ± 0.035 20.260 ± 0.608 7.344 41 VI 105.920 ± 3.178 1.151 ± 0.035 16.950 ± 0.509 7.036 41 VII 97.570 ± 2.927 1.152 ± 0.035 13.420 ± 0.403 6.408 41 VIII 90.280 ± 2.708 1.153 ± 0.035 10.760 ± 0.323 3.455 41 IX 78.540 ± 2.356 1.153 ± 0.035 7.740 ± 0.232 2.988 41 X 54.520 ± 1.636 1.153 ± 0.035 4.590 ± 0.138 11.353 41 I 151.180 ± 4.535 1.141 ± 0.034 21.310 ± 0.639 9.627 35 II 136.390 ± 4.092 1.145 ± 0.034 16.600 ± 0.498 15.062 35 III 130.120 ± 3.904 1.145 ± 0.034 13.380 ± 0.401 8.391 35 IV 129.260 ± 3.878 1.142 ± 0.034 11.410 ± 0.342 15.115 35 7 TeV $ K_S^0 $ 

V 125.460 ± 3.764 1.142 ± 0.034 9.940 ± 0.298 17.698 35 VI 117.220 ± 3.517 1.144 ± 0.034 8.360 ± 0.251 17.015 35 VII 106.880 ± 3.206 1.146 ± 0.034 6.650 ± 0.200 0.198 35 VIII 99.920 ± 2.998 1.147 ± 0.034 5.280 ± 0.158 0.179 35 IX 90.940 ± 2.728 1.146 ± 0.034 3.760 ± 0.113 0.165 35 X 75.180 ± 2.255 1.143 ± 0.034 1.190 ± 0.036 22.741 35 I 176.160 ± 5.285 1.114 ± 0.033 17.430 ± 0.523 23.575 39 II 155.470 ± 4.664 1.117 ± 0.034 13.890 ± 0.417 38.499 39 III 140.000 ± 4.200 1.118 ± 0.034 11.440 ± 0.343 31.564 39 IV 128.250 ± 3.848 1.119 ± 0.034 9.890 ± 0.297 18.789 39 7 TeV $ p+\bar{p} $ 

V 120.630 ± 3.619 1.12 ± 0.034 8.720 ± 0.262 28.602 39 VI 110.990 ± 3.330 1.122 ± 0.034 7.320 ± 0.22 42.152 39 VII 106.900 ± 3.207 1.117 ± 0.034 5.830 ± 0.175 39.765 39 VIII 100.060 ± 3.002 1.115 ± 0.033 4.620 ± 0.139 50.804 39 IX 51.190 ± 1.536 1.136 ± 0.034 3.440 ± 0.103 41.294 39 X 29.420 ± 0.883 1.131 ± 0.034 1.780 ± 0.053 29.893 39 Continued on next page Table 1. Values of the free parameters for various identified particles including light-flavored and strange hadrons, derived from the Tsallis model in hadronic collisions at a center-of-mass energy of 7 TeV.
Table 1-continued from previous page Energy Particle Multiplicity Class T/MeV q $ N_0 $ 

$ \chi^2 $ 

NDF I 206.420 ± 6.193 1.131 ± 0.034 2.650 ± 0.080 23.374 13 II 191.520 ± 5.746 1.131 ± 0.034 2.090 ± 0.063 9.717 13 III 180.210 ± 5.406 1.131 ± 0.034 1.730 ± 0.052 10.111 13 7 TeV ϕ IV & V 167.220 ± 5.017 1.132 ± 0.034 1.380 ± 0.041 4.074 13 VI 140.000 ± 4.200 1.137 ± 0.034 1.050 ± 0.032 9.938 13 VII 114.090 ± 3.423 1.146 ± 0.034 0.820 ± 0.025 3.608 13 VIII 103.150 ± 3.095 1.145 ± 0.034 0.630 ± 0.019 5.45 13 IX 76.530 ± 2.296 1.151 ± 0.035 0.450 ± 0.014 6.28 13 X 33.230 ± 0.997 1.152 ± 0.035 0.260 ± 0.008 3.07 13 I 233.120 ± 6.994 1.091 ± 0.033 12.280 ± 0.368 8.107 13 II 205.870 ± 6.176 1.095 ± 0.033 9.570 ± 0.287 5.738 13 III 195.170 ± 5.855 1.094 ± 0.033 7.670 ± 0.230 5.822 13 IV 166.970 ± 5.009 1.102 ± 0.033 6.550 ± 0.197 4.746 13 7 TeV $ \Lambda + \bar{\Lambda} $ 

V 154.150 ± 4.625 1.104 ± 0.033 5.710 ± 0.171 4.152 13 VI 141.830 ± 4.255 1.105 ± 0.033 4.710 ± 0.141 6.034 13 VII 115.630 ± 3.469 1.112 ± 0.033 3.700 ± 0.111 4.753 13 VIII 105.300 ± 3.159 1.112 ± 0.033 2.850 ± 0.086 6.541 13 IX 79.380 ± 2.381 1.117 ± 0.034 1.920 ± 0.058 9.908 13 X 40.920 ± 1.228 1.124 ± 0.034 0.850 ± 0.026 12.072 13 I 281.770 ± 8.453 1.081 ± 0.032 1.550 ± 0.047 6.867 10 II 271.550 ± 8.147 1.077 ± 0.032 1.130 ± 0.034 4.945 10 III 260.930 ± 7.828 1.072 ± 0.032 0.900 ± 0.027 7.465 10 IV 255.860 ± 7.676 1.072 ± 0.032 0.730 ± 0.022 6.738 10 7 TeV $ \Xi^- + \bar{\Xi}^+ $ 

V 226.900 ± 6.807 1.079 ± 0.032 0.620 ± 0.019 6.21 10 VI 202.860 ± 6.086 1.084 ± 0.033 0.510 ± 0.015 7.544 10 VII 181.730 ± 5.452 1.087 ± 0.033 0.380 ± 0.011 6.451 10 VIII 152.780 ± 4.583 1.094 ± 0.033 0.290 ± 0.009 8.327 10 IX 105.560 ± 3.167 1.108 ± 0.033 0.180 ± 0.005 5.9 10 X 91.010 ± 2.730 1.102 ± 0.033 0.070 ± 0.002 11.781 10 I + II 292.630 ± 8.779 1.079 ± 0.032 0.140 ± 0.004 2.63 3 III + IV 275.340 ± 8.260 1.079 ± 0.032 0.080 ± 0.002 1.583 3 7 TeV $ \Omega^- + \bar{\Omega}^+ $ 

V + VI 234.160 ± 7.025 1.079 ± 0.032 0.080 ± 0.002 1.525 3 VII + VIII 188.450 ± 5.654 1.080 ± 0.032 0.030 ± 0.001 3.411 3 IX + X 106.850 ± 3.206 1.090 ± 0.033 0.010 ± 0.000 9.723 3 Energy Particle Multiplicity class $ T_0 $ /MeV

$ \beta_T $ /c

n $ N_0 $ 

$ \chi^2 $ 

NDF I 80.500 ± 2.415 0.413 ± 0.012 6.350 ± 0.191 303.030 ± 9.091 2.943 46 II 76.220 ± 2.287 0.410 ± 0.012 6.340 ± 0.190 237.600 ± 7.128 2.639 46 III 72.720 ± 2.182 0.409 ± 0.012 6.340 ± 0.190 195.600 ± 5.868 2.417 46 IV 70.560 ± 2.117 0.407 ± 0.012 6.340 ± 0.190 169.100 ± 5.073 2.087 46 7 Tev $ \pi^+ + \pi^- $ 

V 68.760 ± 2.063 0.403 ± 0.012 6.350 ± 0.191 150.300 ± 4.509 1.911 46 VI 66.580 ± 1.997 0.401 ± 0.012 6.370 ± 0.191 128.200 ± 3.846 1.575 46 VII 63.030 ± 1.891 0.400 ± 0.012 6.380 ± 0.191 104.120 ± 3.124 1.234 46 VIII 60.190 ± 1.806 0.400 ± 0.012 6.400 ± 0.192 84.980 ± 2.549 0.868 46 IX 55.340 ± 1.660 0.399 ± 0.012 6.470 ± 0.194 65.310 ± 1.959 0.711 46 X 45.410 ± 1.362 0.396 ± 0.012 6.660 ± 0.200 42.040 ± 1.261 1.546 46 I 112.800 ± 3.384 0.298 ± 0.009 6.660 ± 0.200 43.170 ± 1.295 5.873 41 II 104.000 ± 3.120 0.290 ± 0.009 6.600 ± 0.198 33.340 ± 1.000 13.828 41 III 96.680 ± 2.900 0.281 ± 0.008 6.530 ± 0.196 27.000 ± 0.810 14.799 41 IV 91.020 ± 2.731 0.270 ± 0.008 6.450 ± 0.194 22.970 ± 0.689 13.013 41 7 Tev $ K^+ + K^- $ 

V 86.780 ± 2.603 0.264 ± 0.008 6.420 ± 0.193 20.060 ± 0.602 11.958 41 VI 81.890 ± 2.457 0.258 ± 0.008 6.400 ± 0.192 16.780 ± 0.503 12.21 41 VII 74.720 ± 2.242 0.251 ± 0.008 6.360 ± 0.191 13.290 ± 0.399 10.833 41 VIII 67.450 ± 2.024 0.248 ± 0.007 6.320 ± 0.190 10.600 ± 0.318 8.61 41 IX 56.990 ± 1.710 0.245 ± 0.007 6.330 ± 0.190 7.580 ± 0.227 9.838 41 X 46.430 ± 1.393 0.163 ± 0.005 6.420 ± 0.193 4.390 ± 0.132 5.421 41 I 137.120 ± 4.114 0.223 ± 0.007 6.960 ± 0.209 21.420 ± 0.643 20.389 35 II 128.670 ± 3.860 0.212 ± 0.006 6.890 ± 0.207 16.570 ± 0.497 0.312 35 III 121.200 ± 3.636 0.209 ± 0.006 6.870 ± 0.206 13.430 ± 0.403 0.233 35 IV 116.810 ± 3.504 0.188 ± 0.006 6.810 ± 0.204 11.470 ± 0.344 0.246 35 7 TeV $ K_S^0 $ 

V 109.010 ± 3.270 0.187 ± 0.006 6.710 ± 0.201 10.050 ± 0.302 0.248 35 VI 104.030 ± 3.121 0.175 ± 0.005 6.660 ± 0.200 8.390 ± 0.252 0.249 35 VII 95.960 ± 2.879 0.168 ± 0.005 6.630 ± 0.199 6.690 ± 0.201 0.359 35 VIII 87.330 ± 2.620 0.160 ± 0.005 6.520 ± 0.196 5.320 ± 0.160 0.292 35 IX 70.090 ± 2.103 0.155 ± 0.005 6.360 ± 0.191 3.850 ± 0.116 0.328 35 X 54.970 ± 1.649 0.154 ± 0.005 6.550 ± 0.197 2.080 ± 0.062 23.985 35 I 154.160 ± 4.625 0.171 ± 0.005 8.440 ± 0.253 17.280 ± 0.518 19.259 39 II 137.260 ± 4.118 0.169 ± 0.005 8.370 ± 0.251 13.670 ± 0.410 33.515 39 III 122.490 ± 3.675 0.147 ± 0.004 8.160 ± 0.245 11.290 ± 0.339 26.95 39 IV 118.490 ± 3.555 0.118 ± 0.004 8.160 ± 0.245 9.750 ± 0.293 16.763 39 7 TeV $ p + \bar{p} $ 

V 110.590 ± 3.318 0.116 ± 0.003 8.100 ± 0.243 8.600 ± 0.258 25.739 39 VI 105.590 ± 3.168 0.097 ± 0.003 8.050 ± 0.242 7.190 ± 0.216 39.377 39 VII 96.090 ± 2.883 0.051 ± 0.002 7.920 ± 0.238 5.880 ± 0.176 21.055 39 VIII 90.290 ± 2.709 0.031 ± 0.001 7.920 ± 0.238 4.730 ± 0.142 16.887 39 IX 32.090 ± 0.963 0.031 ± 0.001 6.900 ± 0.207 3.330 ± 0.100 43.803 39 X 19.520 ± 0.586 0.025 ± 0.001 7.420 ± 0.223 1.810 ± 0.054 18.87 39 Continued on next page Table 2. Values of the free parameters for distinct identified particles including light-flavored and strange hadrons, obtained through the application of the Hagedorn model at a center-of-mass energy of 7 TeV.
Table 2-continued from previous page Energy Particle Multiplicity class $ T_0 $ /MeV

$ \beta_T $ /c

n $ N_0 $ 

$ \chi^2 $ 

NDF I 185.940 ± 5.578 0.188 ± 0.006 7.550 ± 0.227 2.63 ± 0.079 21.657 13 II 165.530 ± 4.966 0.214 ± 0.006 7.620 ± 0.229 2.05 ± 0.062 6.609 13 III 150.430 ± 4.513 0.228 ± 0.007 7.580 ± 0.227 1.680 ± 0.050 9.056 13 IV & V 135.000 ± 4.050 0.232 ± 0.007 7.540 ± 0.226 1.330 ± 0.040 4.309 13 7 TeV ϕ VI 118.400 ± 3.552 0.237 ± 0.007 7.510 ± 0.225 1.000 ± 0.030 7.038 13 VII 92.070 ± 2.762 0.203 ± 0.006 6.880 ± 0.206 0.780 ± 0.023 4.749 13 VIII 68.940 ± 2.068 0.196 ± 0.006 6.670 ± 0.200 0.610 ± 0.018 5.4 13 IX 46.620 ± 1.399 0.151 ± 0.005 6.340 ± 0.190 0.430 ± 0.013 7.85 13 X 5.690 ± 0.171 0.159 ± 0.005 6.340 ± 0.190 0.240 ± 0.007 6.316 13 To begin with the discussion of parameter trends, we introduce the plots in Fig. 2. As observed in Fig. 2 (i) and 2 (ii), a noticeable decrease in both T and
$ T_0 $ is apparent when transitioning from multiplicity class I to class X. This trend can be attributed to the fact that, in multiplicity class I, a substantial portion of the colliding systems significantly overlaps, leading to a reduction in overlap as one progresses toward higher multiplicity classes. Consequently, this decrease in overlap results in a diminished energy transfer among the nucleons within the colliding systems. Note that T and$ T_0 $ in Fig. 2 (i) and 2 (ii) are consistent with a mass differential scenario compatible with [41] and our previous results [42−44]. A higher temperature causes heavier particles to decouple from the system earlier than lighter particles. The reason behind the early freeze-out of the massive particles is that they have lower production rates due to higher energy requirements. Therefore, they become less abundant and more susceptible to freeze-out at higher temperatures compared to lighter particles. Besides, we observed that the temperature (effective and kinetic freeze-out temperatures) of the lighter particles is weakly dependent on multiplicity while this dependence becomes more significant as the particle mass increases, which is consistent with the results reported by Khuntia et al. [41]. A possible explanation for this phenomenon could be as follows. Light particles have a lower kinetic freeze-out temperature, indicating weaker interactions with the surrounding medium. As a result, they are less responsive to variations in multiplicity. Conversely, heavier particles interact more strongly with the medium, rendering them more susceptible to changes in multiplicity. In addition, the values of transverse flow velocity in Fig. 2 (iii) were observed to be minimum at higher multiplicity classes and maximum at lower classes of multiplicity. In scenarios with lower multiplicity classes, more energy is transferred into the system, leading to a stronger pressure gradient in the collision zone and the creation of a highly compressed system. This compressed system holds considerable collision energy in potential form. Consequently, as the system begins to expand, it does so with a notably high transverse flow velocity. Conversely, higher multiplicity classes involve lesser energy transfer into the system, resulting in a less pronounced pressure gradient within the collision zone. This leads to a lower level of compression in the system, ultimately causing the expanding system to have a lower transverse flow velocity. Similar to$ T_0 $ ,$ \beta_T $ also has a strong dependence on multiplicity for heavier particles and weak dependence on multiplicity for lighter particles. The correlation between$ T_0 $ and$ \beta_T $ is revealed to be positive in Fig. 3. The positive correlation is related to the high temperature and quick expansion of the system. The lower multiplicity class refers to the central collisions, whereas the higher multiplicity class refers to the peripheral collisions. Hence, the above results show that the lower multiplicity class reaches a very high temperature and expands quickly. In previous studies [14], the correlation between$ T_0 $ and$ \beta_T $ is negative. Both positive and negative correlations are correct and have their own explanations. The negative correlation is associated to the longer-lived fireball in lower multiplicity classes. The positive correlation between kinetic freeze-out temperature and transverse flow velocity indicates that, in high-energy collisions, particles with higher thermal energies also exhibit stronger collective motion. The higher multiplicity is associated with the higher energy transfer into the system, owing to which the excitation function of the system increases, resulting in the hadronization of highly thermalized particles. By contrast, owing to the fact that the same higher energy is transferred into the system at higher multiplicity, the system squeezes and then expands rapidly with greater$ \beta_T $ . Therefore, greater$ \beta_T $ will always be accompanied by greater$ T_0 $ , and vice versa. Finally, the multiplicity parameter ($ N_0 $ ) exhibits a decline as the masses of produced particles increase, indicating a more prominent production of lighter particles in contrast to heavier ones. Additionally,$ N_0 $ demonstrates a diminishing trend as one progresses toward higher multiplicity classes. The connection between higher multiplicity classes and lower collision energies or centrality of particle collisions might explain the smaller values of$ N_0 $ in these scenarios.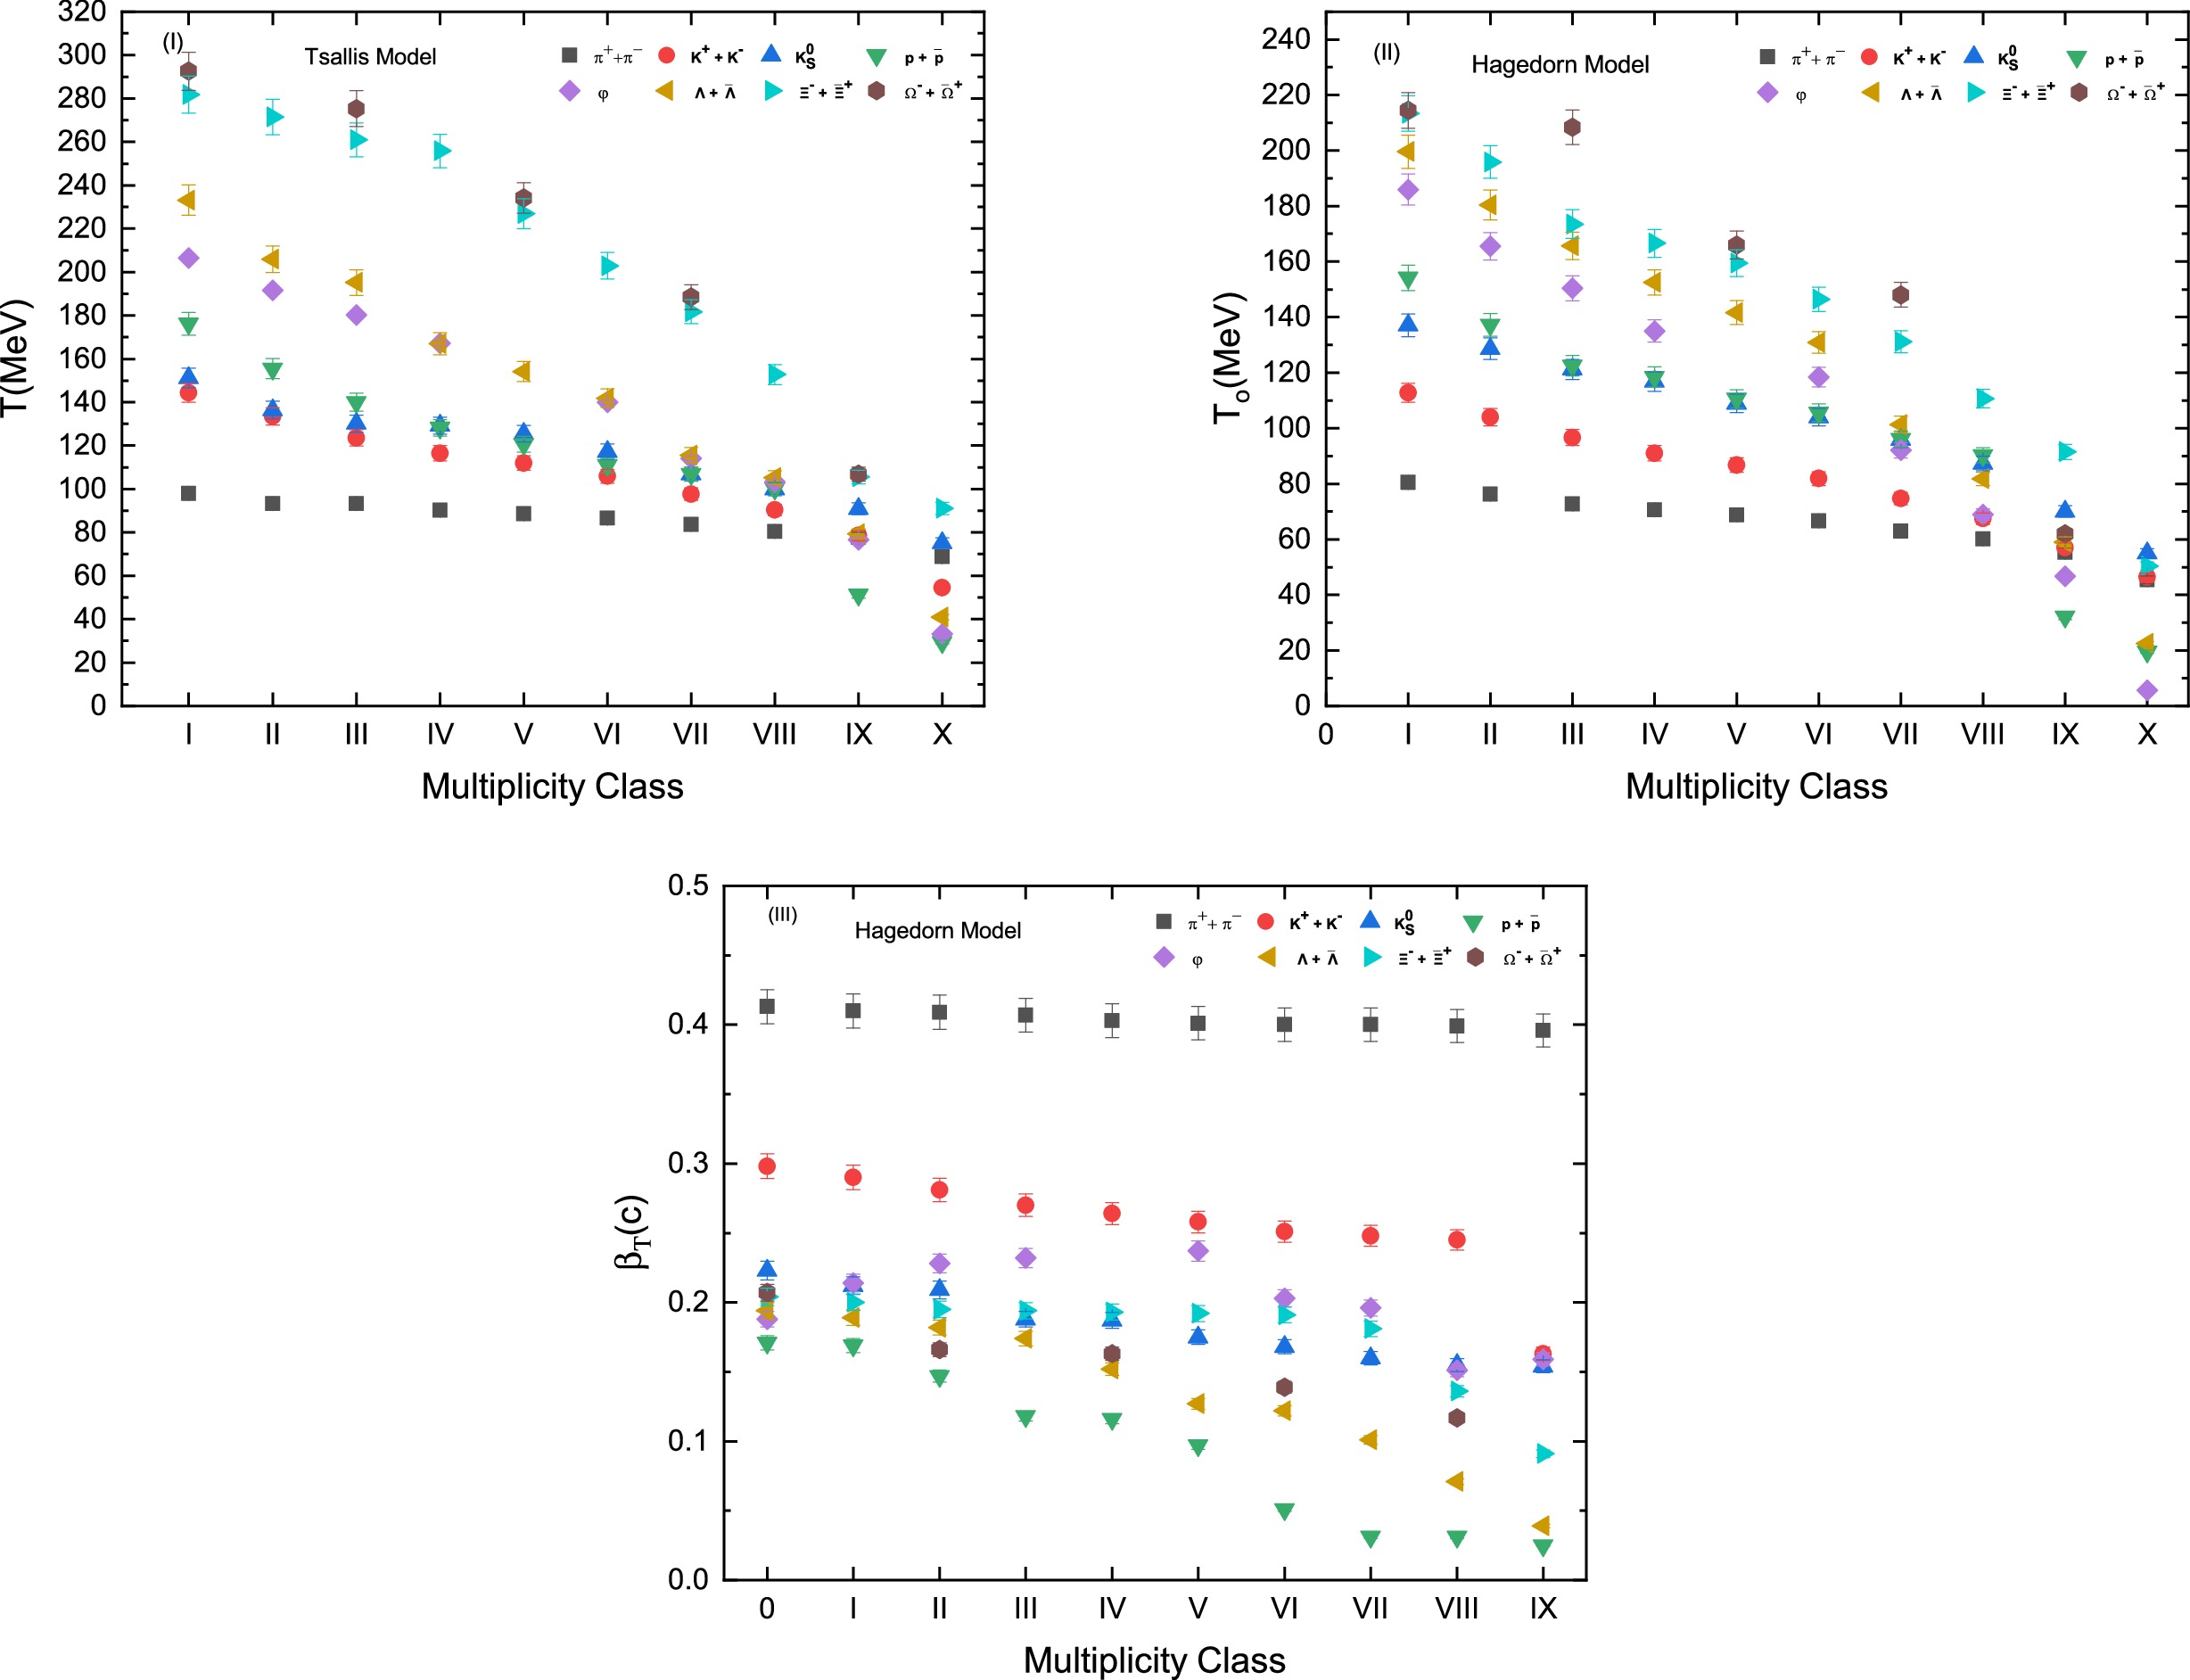
Figure 2. (color online) Correlation plots showing diverse parameters obtained through the fitting of
$ p_T $ spectra for various light-flavored and strange hadrons generated in proton-proton collisions at a center-of-mass energy of$ \sqrt{s} $ = 7 TeV across different multiplicity classes. The fitting process involves the utilization of both the Tsallis and Hagedorn models. These correlation plots offer insights into the relationships between the extracted parameters.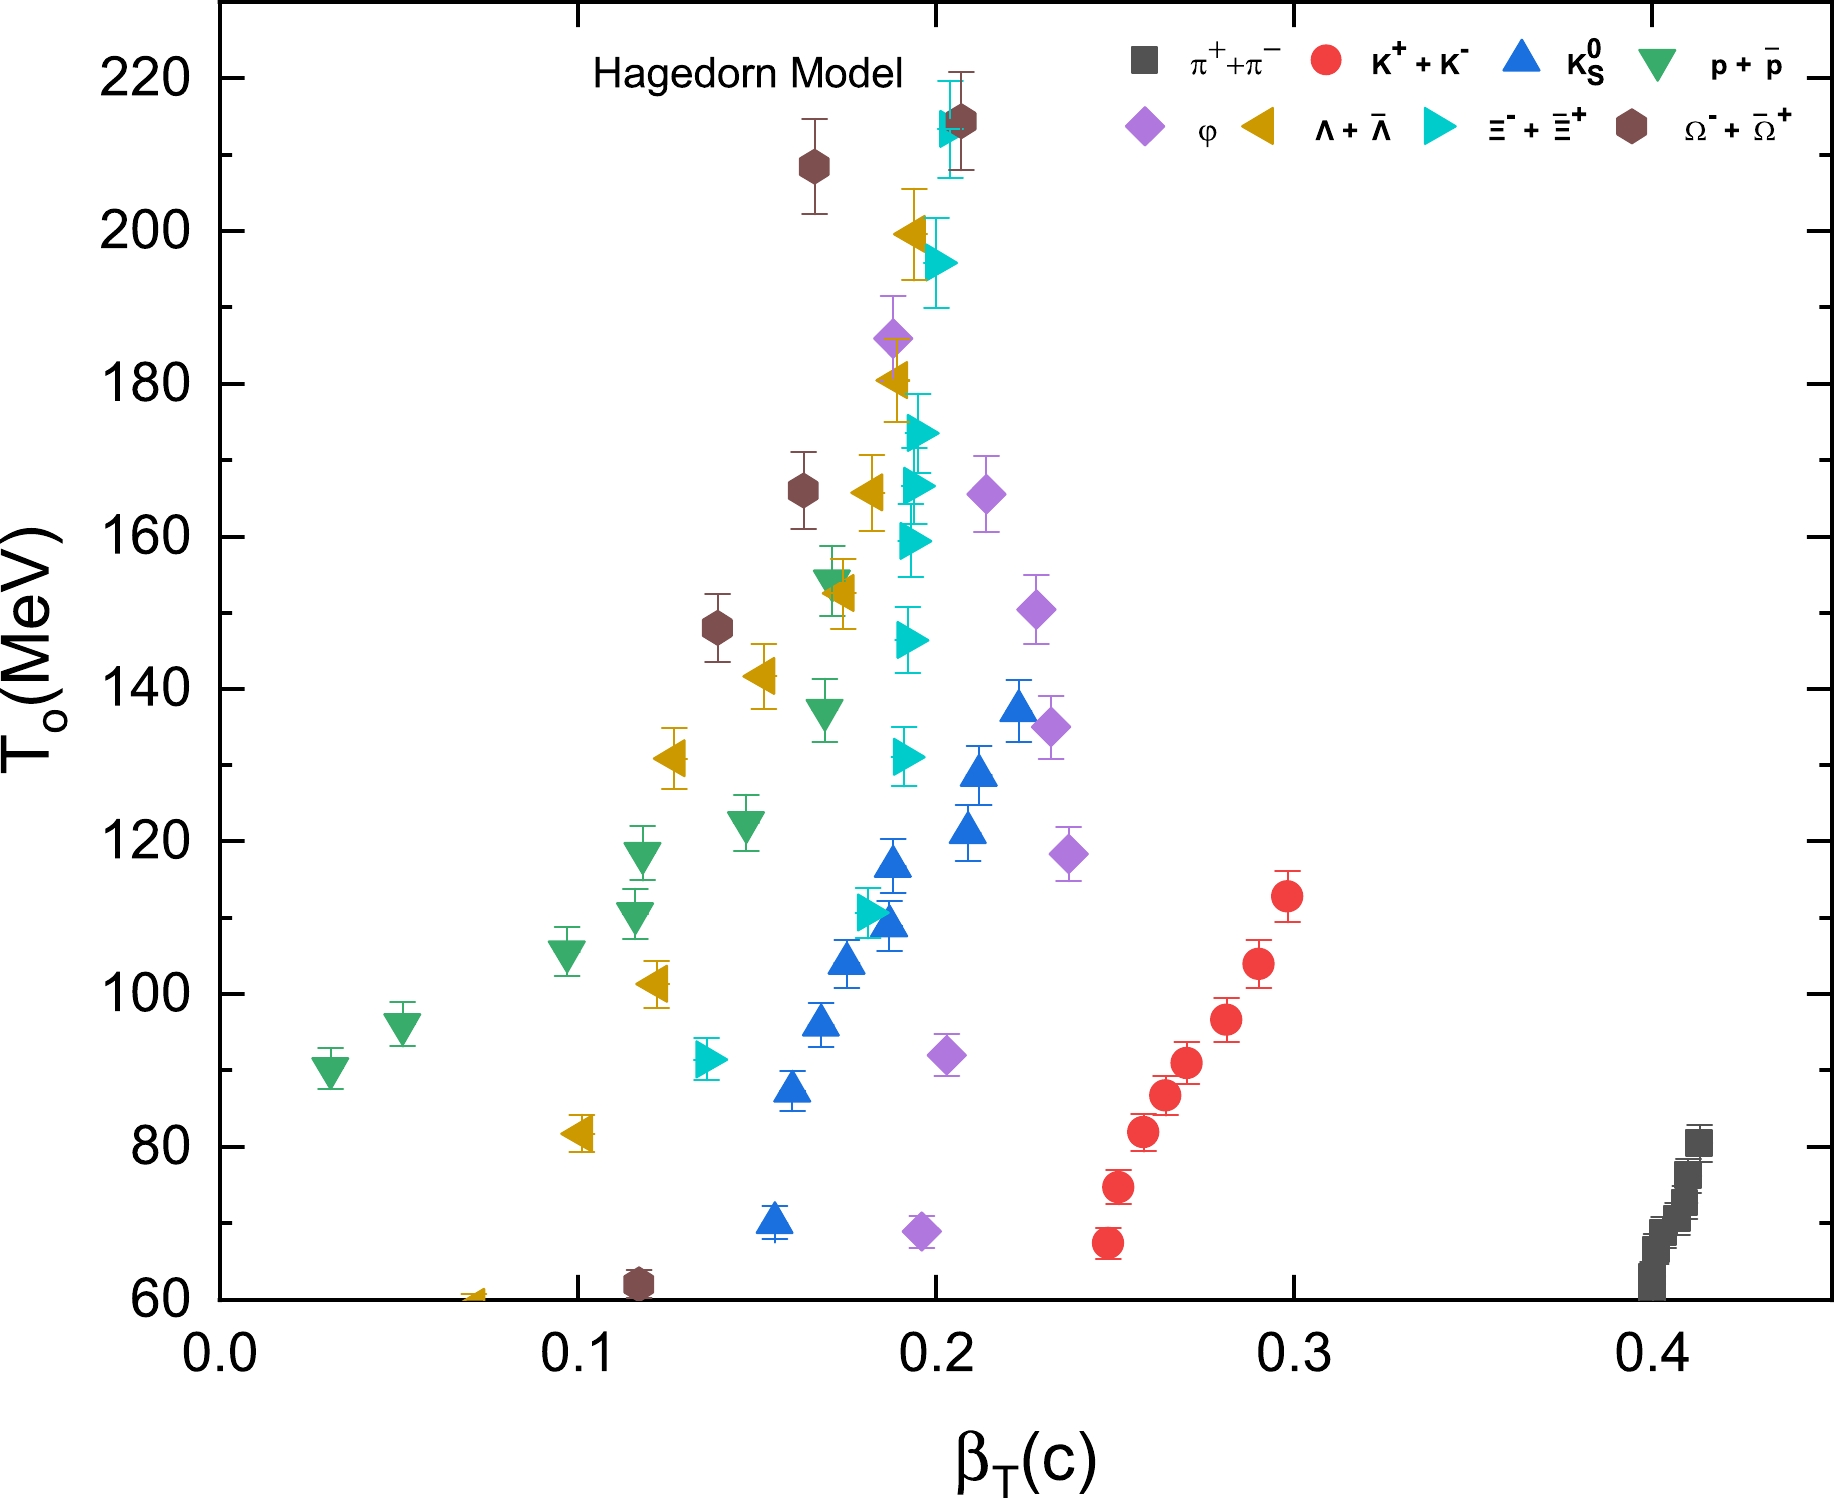
Figure 3. (color online) Correlation plot depicting the relationship between the kinetic freeze-out temperature (
$ T_0 $ ) and transverse flow velocity ($ \beta_T $ ). These parameters were extracted through a fitting procedure applied to the$ p_T $ spectra of light-flavored and strange hadrons produced in proton-proton collisions at a center-of-mass energy of$ \sqrt{s} $ = 7 TeV. This fitting procedure was carried out by employing the Hagedorn model. The resulting correlation plot provides insights into the interplay between$ T_0 $ and$ \beta_T $ . -
The analysis of transverse momentum spectra for identified particles, encompassing both light-flavored and strange hadrons, was based on the Tsallis and Hagedorn models. It was found that both models satisfactorily fit experimental data. We extracted the effective temperature (T), kinetic freeze-out temperature (
$ T_0 $ ), and transverse flow velocity ($ \beta_T $ ). These parameters exhibited an increase as we moved toward lower multiplicity classes, driven by the higher energy transfer in such cases. It is important to highlight that both$ T_{\rm eff} $ and$ T_0 $ exhibited an upward trend with the rising masses of particle species, thereby confirming the existence of a multi-freeze-out scenario. In this scenario, lighter particles experience freeze-out later than heavier particles.The normalization constant, or multiplicity parameter, exhibits a direct correlation with collision event multiplicity, underscoring reduced particle production in higher multiplicity classes. In contrast, this constant exhibits an inverse relationship with the masses of the generated particles, indicating diminished production of heavier hadrons compared to lighter ones. A weak dependence of temperature (effective and kinetic freeze-out) on multiplicity was observed for lighter particles, while heavier particles exhibited a strong temperature dependence. One possible explanation for this trend is as follows. Light particles tend to possess a lower kinetic freeze-out temperature, indicating less interaction with the surrounding medium. Consequently, they exhibit reduced sensitivity to shifts in multiplicity. Conversely, heavier particles engage in stronger interactions with the medium, rendering them more responsive to changes in multiplicity.
Moreover, our study reveals a positive correlation between transverse flow velocity and kinetic freeze-out temperature. This positive correlation suggests that there is a higher degree of excitation in the lower multiplicity classes (higher multiplicity events), which corresponds to higher temperatures and quick expansion.
-
M. Ajaz: Conceptualization, Methodology, Writing original draft. M. Shehzad: Formal analysis, Visualization. M. Waqas: Formal analysis, Visualization. H. I. Alrebdi: Methodology, Writing review & editing, Funding acquisition, Visualization. A. Jagnandan: Software, Methodology. M. A. Ahmad: Software, Methodology. S. Jagnandan: Software, Formal analysis. M. Badshah: Methodology, Writing original draft. J. H. Baker: Methodology, Investigation, Writing review & editing. A. M. Quraishi: Supervision, Methodology.
-
The authors declare that there are no known financial interests or personal relationships that could have potentially influenced the findings presented in this paper.
-
The data utilized in this study are either provided within the manuscript itself or appropriately referenced at relevant points.
Multiplicity dependence of the freezeout parameters in high energy hadron-hadron collisions
- Received Date: 2023-11-24
- Available Online: 2024-05-15
Abstract: We examined the transverse momentum (


 DownLoad: