


 Abstract
 HTML
HTML Reference
 Related
 PDF
PDF


-
One of the most fundamental questions in hadron physics is related to the mechanism of color confinement in Quantum Chromodynamics (QCD). Color-singlet hadronic configurations of quarks and gluons can form bound states or resonances. Besides the well-known combinations of
q\bar{q} for mesons andqqq for baryons, other combinations, such asgq\bar{q} for hybrid states [1], multi-gluons for glueball states [2],q\bar{q}q\bar{q} for tetraquark states [3],qqqq\bar{q} for pentaquark states [4] and hexaquark states(qqqqqq) [5], are also allowed by QCD. Di-baryon [6] and hexaquark states have been searched for in a range of nucleon-nucleon scattering reactions. Recently, an isoscalar resonant structure was observed in the isoscalar two-pionic fusion processpn \to d\pi^0\pi^0 [7] by the WASA Collaboration and was later confirmed in the other two-pionic fusion processespn\to d\pi^+\pi^- [8] andpp\to d\pi^+\pi^0 [9], and the two-pionic non-fusion processpn\to pp\pi^0\pi^- [10] andpn\to pn\pi^0\pi^0 [11]. This state was denoted byd^*(2380) following the convention used for nucleon excitations. These observations indicate the possibility of the existence of hexaquark and di-baryon configurations. In 2021, the BESIII Collaboration reported the search for hexaquark and di-baryon states in examining the invariant mass spectra of two baryons in the processe^+e^- \to 2(p\bar{p}) [12], and no significant signal was observed.Analyzing data sets corresponding to a total integrated luminosity of approximately
18.8 ~\rm fb^{-1} taken at center-of-mass energies\sqrt s between4.16 and4.70 GeV with the BESIII detector, we present in this paper the first measurement of the cross section of the processe^+e^- \to pp\bar{p}\bar{n}\pi^{-} + c.c. . We search for thed^*(2380) and other possible hexaquark or di-baryon states with the data samples with energies above4.60 GeV, where the\bar{p}\bar{n} system with a mass around2.4 GeV ford^*(2380) is kinematically accessible. The mass range of the\bar{p}\bar{n} system around 2.4 GeV/c^2 , in which thed^*(2380) might contribute, is covered by the data samples with energies above4.60 GeV. Throughout this paper, charge conjugation is always implied unless explicitly stated, and in discussing systematic uncertainties. -
The BESIII detector [13] records symmetric
e^+e^- collisions provided by the BEPCII storage ring [14], which operates in the center-of-mass energy range from2.0 to4.95 GeV. BESIII has collected large data samples in this energy region [15]. The cylindrical core of the BESIII detector covers93\% of the full solid angle and consists of a helium-based multilayer drift chamber (MDC), a plastic scintillator time-of-flight system (TOF), and a CsI(Tl) electromagnetic calorimeter (EMC), which are all enclosed in a superconducting solenoidal magnet providing a1.0 T magnetic field. The solenoid is supported by an octagonal flux-return yoke with resistive plate counter muon identification modules interleaved with steel. The charged-particle momentum resolution at1\; {\rm GeV}/c is0.5 %, and the specific energy loss (dE/dx) resolution is6\% for electrons from Bhabha scattering. The EMC measures photon energies with a resolution of2.5\% (5\% ) at1 GeV in the barrel (end cap) region. The time resolution in the TOF barrel region is68 ps, while that in the end cap region is110 ps. The end cap TOF system was upgraded in2015 using multi-gap resistive plate chamber technology, providing a time resolution of60 ps [16, 17].The data sets were collected at
29 center-of-mass energies between4.16 and4.70 GeV. The nominal energies of the data sets from4.16 to4.60 GeV are measured by the di-muon processe^+e^- \to (\gamma_{\rm ISR/FSR})\mu^{+}\mu^{-} [18, 19], where the subscript ISR/FSR stands for the initial-state or final-state radiation process, respectively. Those for the data sets from4.61 to4.70 GeV are calibrated by the processe^+e^- \to \Lambda_{\rm c}^{+}\bar{\Lambda}_{\rm c}^{-} [20]. The integrated luminosity\mathcal{L}_{\rm int} is determined using large-angle Bhabha scattering events [20, 21]. The total integrated luminosity of all data sets is approximately18.8 ~\rm fb^{-1} .The response of the BESIII detector is modeled with Monte Carlo (MC) simulations using the software framework BOOST [22] based on geant4 [23], which includes the geometry and material description of the BESIII detector, the detector response and digitization models, as well as a database that keeps track of the running conditions and the detector performance. Large MC simulated event samples are used to optimize the selection criteria, evaluate the signal efficiency, and estimate background contributions.
Inclusive MC simulation samples are generated at different center-of-mass energies to study potential background reactions. These samples consist of open charm processes, the ISR production of vector charmonium and charmonium-like states, and the known hadronic continuum processes incorporated in KKMC [24, 25]. The known decay modes are modeled with EVTGEN [26, 27] using branching fractions taken from the Particle Data Group (PDG) [28], and the remaining unknown decays of the charmonium states are simulated with LUNDCHARM [29, 30]. Final-state radiation from charged final-state particles is incorporated with PHOTOS [31]. The signal MC simulation sample of
e^+e^- \to p p \bar{p} \bar{n} \pi^{-} at each energy point is generated with the events being uniformly distributed in phase space. -
Events with two positive and two negative charged tracks are selected. For each charged track, the polar angle in the MDC with respect to the z direction must satisfy
| \cos\theta|<0.93 . All charged tracks are required to originate from the interaction region, defined asR_{xy}<1 cm and|V_{z}|<10 cm, whereR_{xy} and|V_{z}| are the distances from the point of closest approach of the tracks to the interaction point in thex-y plane and in the z direction, respectively. The combined dE/dx and TOF information are used to calculate particle identification (PID) confidence levels for the pion, kaon, and proton hypotheses. Each track is assigned as the particle hypothesis with the highest confidence level. The final state in thee^+e^- \to p p \bar{p} \bar{n} \pi^{-} process is reconstructed with two protons, one antiproton and one\pi^{-} . In this paper, charge conjugated process is implied.Since the neutron can not be well reconstructed with the BESIII detector, the signal process is determined via the recoiling mass of the reconstructed charged particles, defined as
\begin{equation} M_{\rm rec}c^2= \sqrt{(E_{e^+e^-} - E_{pp\bar{p}\pi^-})^{2} - (\vec{P}_{e^+e^-} - \vec{P}_{pp\bar{p}\pi^-})^{2} \cdot c^2}, \end{equation}

(1) where
E_{e^{+}e^{-}} and\vec{P}_{e^{+}e^{-}} are the center-of-mass energy and the momentum of thee^{+}e^{-} system, respectively;E_{pp\bar{p}\pi^{-}} and\vec{P}_{pp\bar{p}\pi^{-}} are the total reconstructed energy and total momentum of thepp\bar{p}\pi^{-} system, respectively. Events withM_{\rm rec} greater than0.8 GeV/c^2 are kept for further analysis.Studies based on the inclusive MC simulation samples [32] show that no peaking background events survive the selection criteria. To further suppress background events, two additional selection criteria are imposed on the accepted candidate events. First, the invariant mass
M_{p\pi^-} of the reconstructedp\pi^- system is required to be outside the Λ signal region, i.e.|M_{p\pi^-}- 1.115|>0.010 GeV/c^2 , to remove the possible background associated with Λ decays. Here, 1.115 GeV/c^2 is the known Λ mass [33], and 0.010 GeV/c^2 corresponds to about three times the mass resolution. Second, the invariant mass ofpp\bar{p} (M_{pp\bar{p}} ) must be less than3.6 GeV/c^2 due to the remaining neutron and pion in the event.The
M_{\rm rec} distribution of the accepted candidates after the above selection criteria from the combined data sets is displayed in Fig. 1, where a significant neutron signal is observed. The signal yield is determined by a maximum likelihood fit to this distribution. In the fit, the signal is represented by the luminosity weighted MC-simulated shape convolved with a Gaussian function and the remaining background is described by a linear function. From the fit, the signal yield is determined to be123\pm14 . The statistical significance of the signal is determined to be11.5\sigma , which is evaluated as\sqrt{-2\ln(\mathcal{L}_0/\mathcal{L}_{\rm max})} , where\mathcal{L}_{\rm max} is the maximum likelihood of the nominal fit and\mathcal{L}_0 is the likelihood of the fit without involving the signal component. The change of the degree of freedom is1 . The neutron signal region is defined asM_{\rm rec}\in(0.925, 0.968) GeV/c^2 and the corresponding sideband regions are defined asM_{\rm rec}\in (0.857, 0.900)\cup (0.990, 1.033) GeV/c^2 .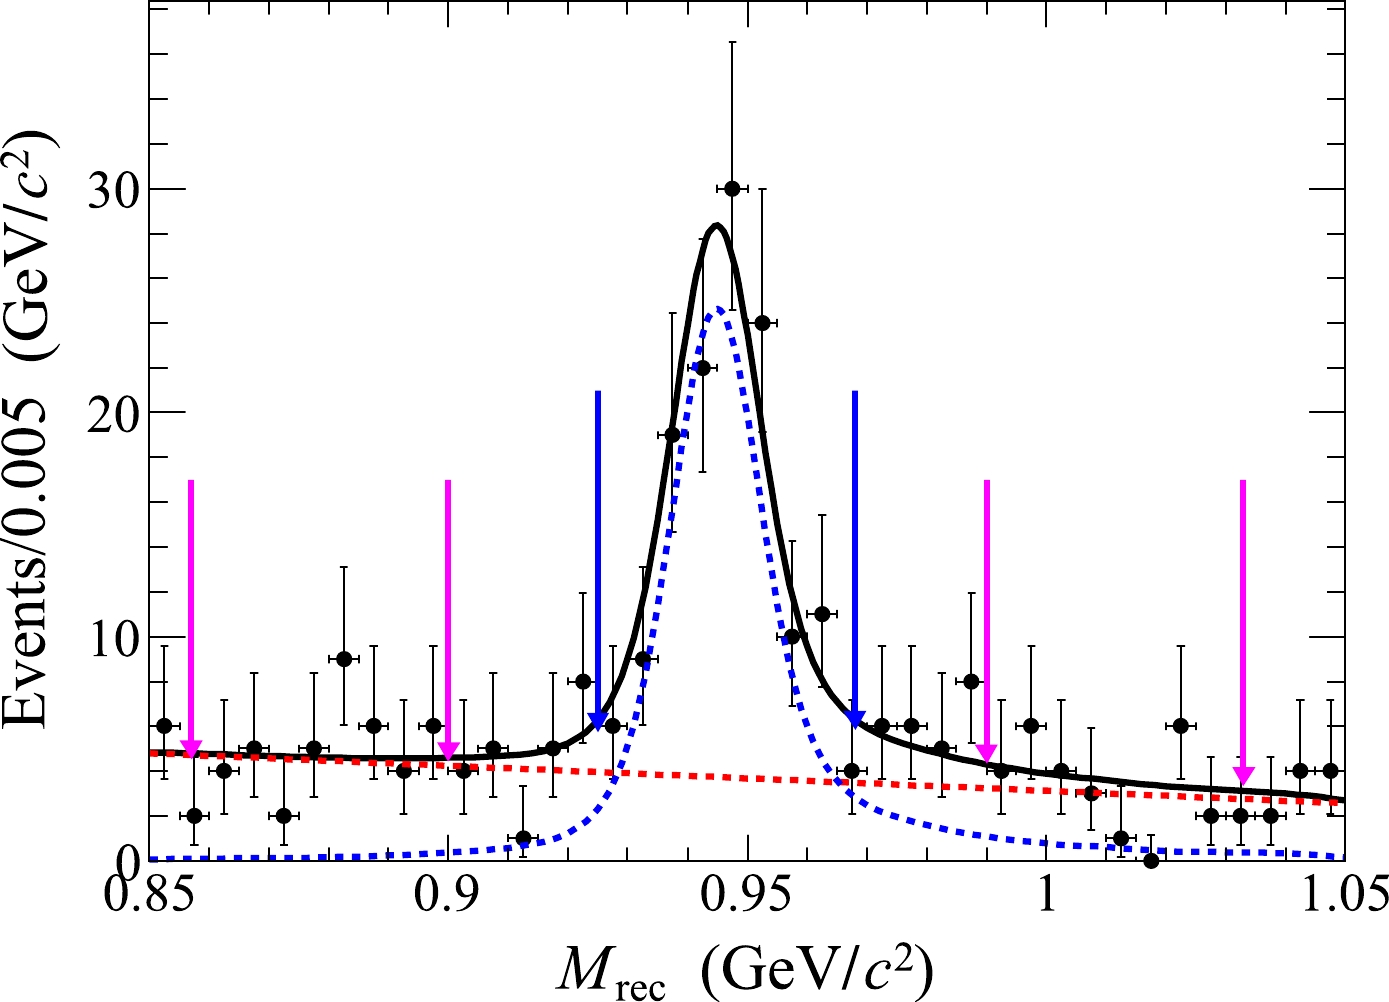
Figure 1. (color online) Distribution of the recoiling mass
M_{\rm rec} of the candidate events for the reactione^+e^-\to p p \bar{p} \bar{n} \pi^{-} with the fit results overlaid. The dots with error bars are from the combined data sets, the black curve shows the total fit result, and the dashed blue (red) curve represents the signal (background) shape. The pair of blue arrows marks the neutron signal region, whereas the neutron sideband regions are visualized by the two pairs of pink arrows.Figure 2 shows the comparisons of the momentum and polar angle distributions of the neutron of the accepted candidate events between data and signal MC simulation samples, where the data distribution is from the combined data sets and the MC simulation distribution has been weighted by the signal yields in data. The invariant mass of any two or three particles, the momentum and
\cos\theta distributions of the other final state particles have also been examined. The agreement between data and MC simulation allows to determine the detection efficiency with the signal MC simulation events generated uniformly distributed in the five-body phase space.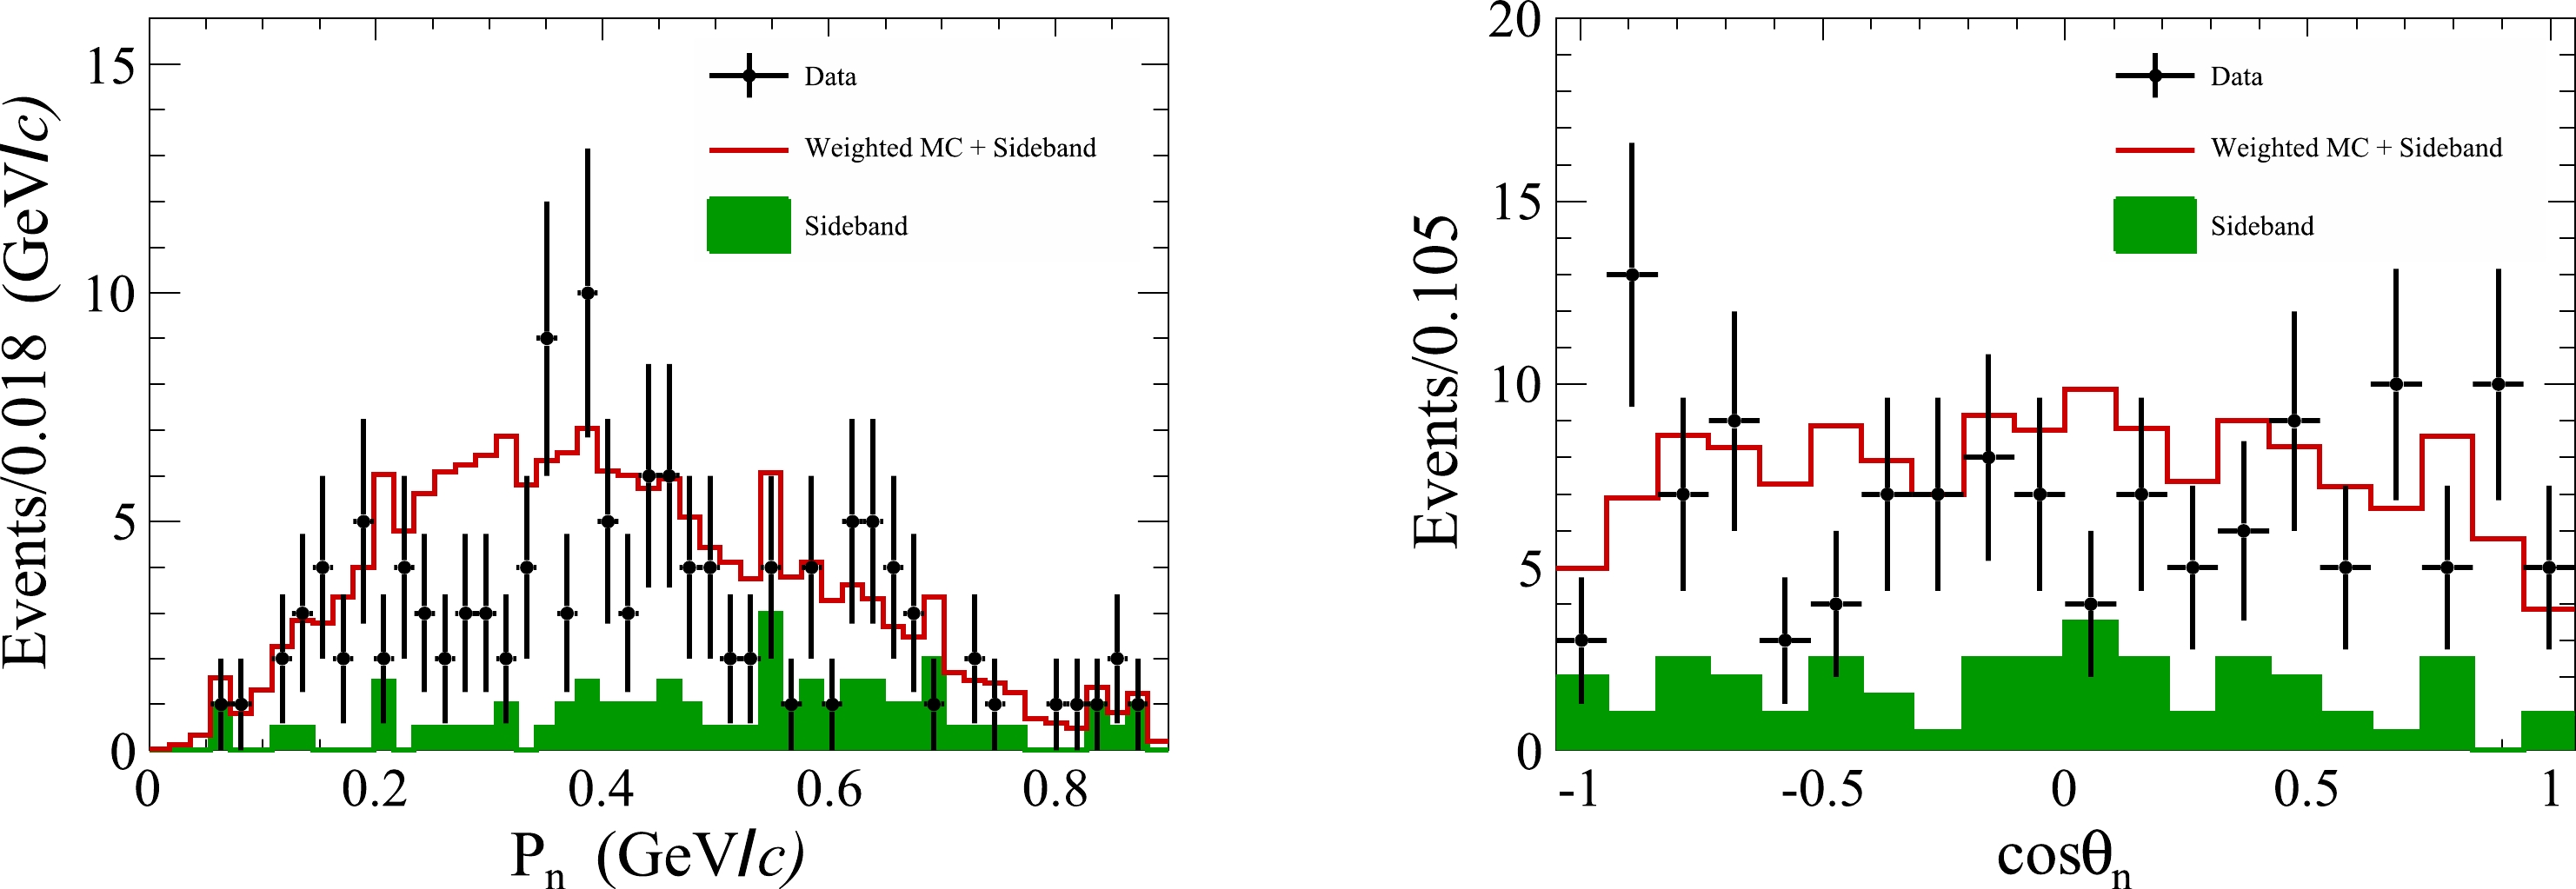
Figure 2. (color online) Momentum (left) and polar angular distributions (right) of the neutrons of the candidate events for the reaction
e^+e^-\to p p \bar{p} \bar{n} \pi^{-} . The dots with error bars represent the combined data sets. The green histograms represent the sideband events. The red histograms represent the weighted signal MC simulation events plus the normalized neutron sideband regions in data.To search for hexaquark and di-baryon states, the
\bar{p}\bar{n} invariant mass spectrum is examined. Figure 3 shows thepp\pi^{-} and\bar{p}\bar{n} invariant mass spectra of the candidate events for the reactione^+e^-\to p p \bar{p} \bar{n} \pi^{-} . In the fit toM_{\bar{p}\bar{n}} , the signal is represented by the luminosity weighted phase space MC simulation shape and the remaining combinatorial background is described by a linear function. The goodness-of-fit is\chi^2/ndf= 38.21/37 . Here,ndf is the number of degrees of freedom. Compared to the phase space hypothesis, no obvious structure is observed.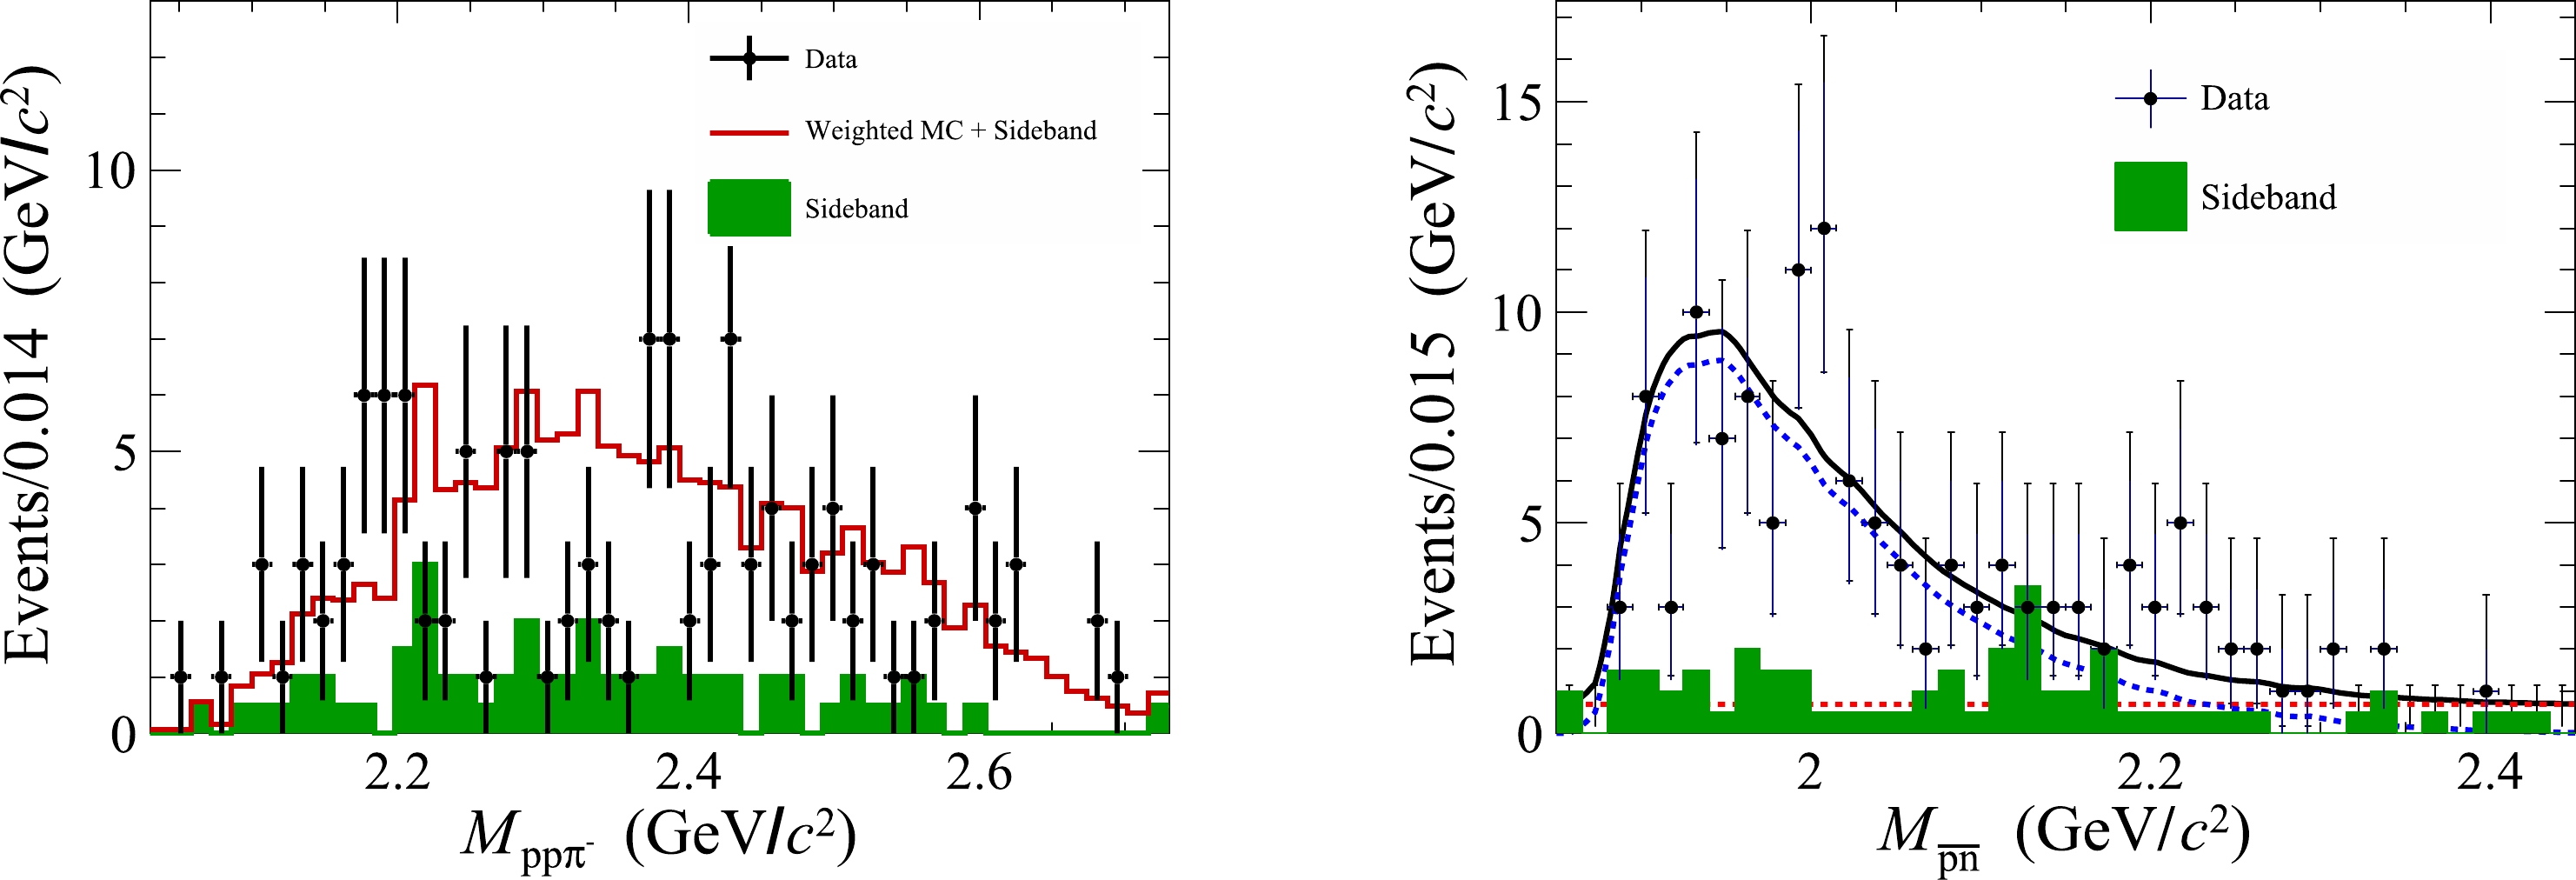
Figure 3. (color online) The
pp\pi^{-} (left) and\bar{p}\bar{n} (right) invariant mass spectra of the candidate events fore^+e^-\to p p \bar{p} \bar{n} \pi^{-} . The dots with error bars represent the combined data sets. The green histograms are the normalized neutron sideband events in data. The red histogram represents the weighted signal MC simulation events plus the normalized neutron sideband events in data. The black solid curve shows the total fit result, the blue dashed curve is the signal shape derived from the signal MC simulation sample, and the red dashed line is the linear background shape. -
In a data set for each energy point, only a few events have been observed in the neutron signal region, with a statistical significance of less than
3\sigma . To obtain significant neutron signals the data sets are combined into three sub-samples in the energy ranges of (4.160, 4.380), (4.400, 4.600) and (4.610, 4.700) GeV for further analysis.The average observed cross section for
e^+e^- \to p p \bar{p} \bar{n} \pi^{-} is calculated by\begin{equation} \overline{\sigma}_j^{\rm obs} = \frac{N_j^{\rm sig}}{ {\Sigma_i {\epsilon_{ ji}}} \cdot {\mathcal{L}_{ ji}} } , \end{equation}

(2) where
N_j^{\rm sig} is the number of signal events from the j-th combined data set,\mathcal{L}_{i} and\epsilon_{i} are the integrated luminosity and efficiency of data set i, respectively, i represents the i-th energy point in j-th combined data set. The detection efficiency is corrected by correction factors for the PID and tracking efficiencies,{f_{\rm PID}} and{f_{\rm trk}} , which are determined to be0.92 and0.98 by weighting the differences between efficiency experimentally determined and that in the MC simulation in different momentum ranges, respectively. Inserting the numbers which are listed in Table 1 into Eq. (2) yields the average observed cross sections(19.4\pm5.1\pm1.0) fb,(42.8\pm9.8\pm2.3) fb and(54.2\pm 8.6\pm 2.9) fb for the three combined data sets, respectively, where the first uncertainties are statistical and the second are systematic.\sqrt{s} /GeV

\mathcal{L} /pb

^{-1} 

\epsilon (%)

(1+\delta^{\gamma}) 

N_{\rm sig} 

\overline{\sigma}^{\rm obs} /fb

\overline{\sigma}^{\rm Born} /fb

4.1574 408.70 4.2 0.8408 4.1780 3189.0 6.0 0.8388 4.1889 526.70 7.1 0.8430 4.1990 526.00 8.1 0.8456 4.2092 517.10 8.8 0.8485 4.2188 514.60 9.6 0.8509 4.2263 1056.40 10.1 0.8489 4.2358 530.30 11.4 0.8530 4.2439 538.10 12.0 0.8552 22.7\pm6.0 

19.4\pm5.1 

21.5\pm5.7 

4.2580 828.40 13.5 0.8559 4.2668 531.10 14.0 0.8587 4.2777 175.70 14.8 0.8593 4.2878 502.40 14.2 0.8612 4.3121 501.20 16.2 0.8628 4.3374 505.00 18.6 0.8646 4.3583 543.90 21.8 0.8693 4.3774 522.70 21.0 0.8668 4.3965 507.80 22.6 0.8674 30.9\pm7.1 

42.8\pm9.8 

46.3\pm10.6 

4.4156 1043.90 24.8 0.8764 4.4362 569.90 25.0 0.8683 4.4671 111.09 27.4 0.8794 4.5271 112.12 30.7 0.8838 4.5995 586.90 34.0 0.8876 4.6152 103.83 33.5 0.8712 69.4\pm11.0 

54.2\pm8.6 

59.0\pm9.4 

4.6304 521.52 34.1 0.8710 4.6431 552.41 34.5 0.8708 4.6639 529.63 35.7 0.8712 4.6842 1669.31 36.3 0.8711 4.7008 536.45 36.6 0.8710 Table 1. The average observed cross sections for the reaction
e^+e^- \to p p \bar{p} \bar{n} \pi^{-} + c.c. . Summary of the number of signal events (N_{\rm sig} ), integrated luminosity (\mathcal{L} ), detection efficiency (\epsilon ), radiative correction factors(1+\delta^{\gamma}) , the average observed cross section (\overline{\sigma}^{\rm obs} ) and average Born cross section (\overline{\sigma}^{\rm Born} ) at different c.m. energies (\sqrt{s} ). The uncertainties are statistical only.To measure the average Born cross section of
e^+e^- \to p p \bar{p} \bar{n} \pi^{-} , a similar lineshape as that ofe^+e^- \to 2(p\bar{p}) [12] is assumed to determine the ISR and vacuum polarization correction factors,(1+\delta^{\gamma}) and\frac{1}{\vert 1-\Pi\vert^2} , as they are similar reactions where one of the\bar{p} has been exchanged by\bar{n}\pi^- . The lineshape is constructed as\begin{equation} \sigma^{\rm Born}(s) = \frac{1}{s} \times {\rm e}^{p_{\rm0}(\sqrt{s}-M_\text{th})} \times p_{\rm 1}, \end{equation}

(3) where
p_{0} andp_{1} are free parameters,M_\text{th} = (3m_{p}+ m_{n}+ m_{\pi^-}) ,m_p ,m_n , andm_{\pi^-} are the known masses of p, n, and\pi^- taken from the PDG [33]. The average Born cross section is calculated by\begin{equation} \overline{\sigma}_j^{\rm Born} = \frac{\overline{\sigma}_j^{\rm obs}}{(1+\delta^{\gamma})_j \cdot \left(\dfrac{1}{\vert 1-\Pi\vert^2}\right)_j} . \end{equation}

(4) The obtained Born cross sections are then used as input in the generator and the cross section measurements are iterated with the updated detection efficiencies. This process is repeated until the
(1+\delta^{\gamma}) \cdot \epsilon values become stable at all energies,i.e. the difference of(1+\delta^{\gamma}) \cdot \epsilon between the last two iterations is less than4\% . Figure 4 shows the obtained average Born cross sections in the defined sub-samples. The average Born observed cross sections are calculated with Eq. (4), and the results are(21.5\pm5.7\pm 1.2) fb,(46.3\pm10.6\pm2.5) fb and(59.0\pm9.4\pm 3.2) fb for the three combined data sets, respectively, where the first uncertainties are statistical and the second are systematic. Two different functions are used to compare the trend of the average Born cross section to a reaction where a similar behaviour is expected. The first one is a simple five-body energy-dependent phase space lineshape [12, 34] and the second one is an exponential function [12, 35], which are shown in Fig. 4. However, it should be noted that the two functions in Fig. 4 are not fit results, but drawn with arbitrary scale factors for comparison since a qualitative fit is not possible due to the limited statistics.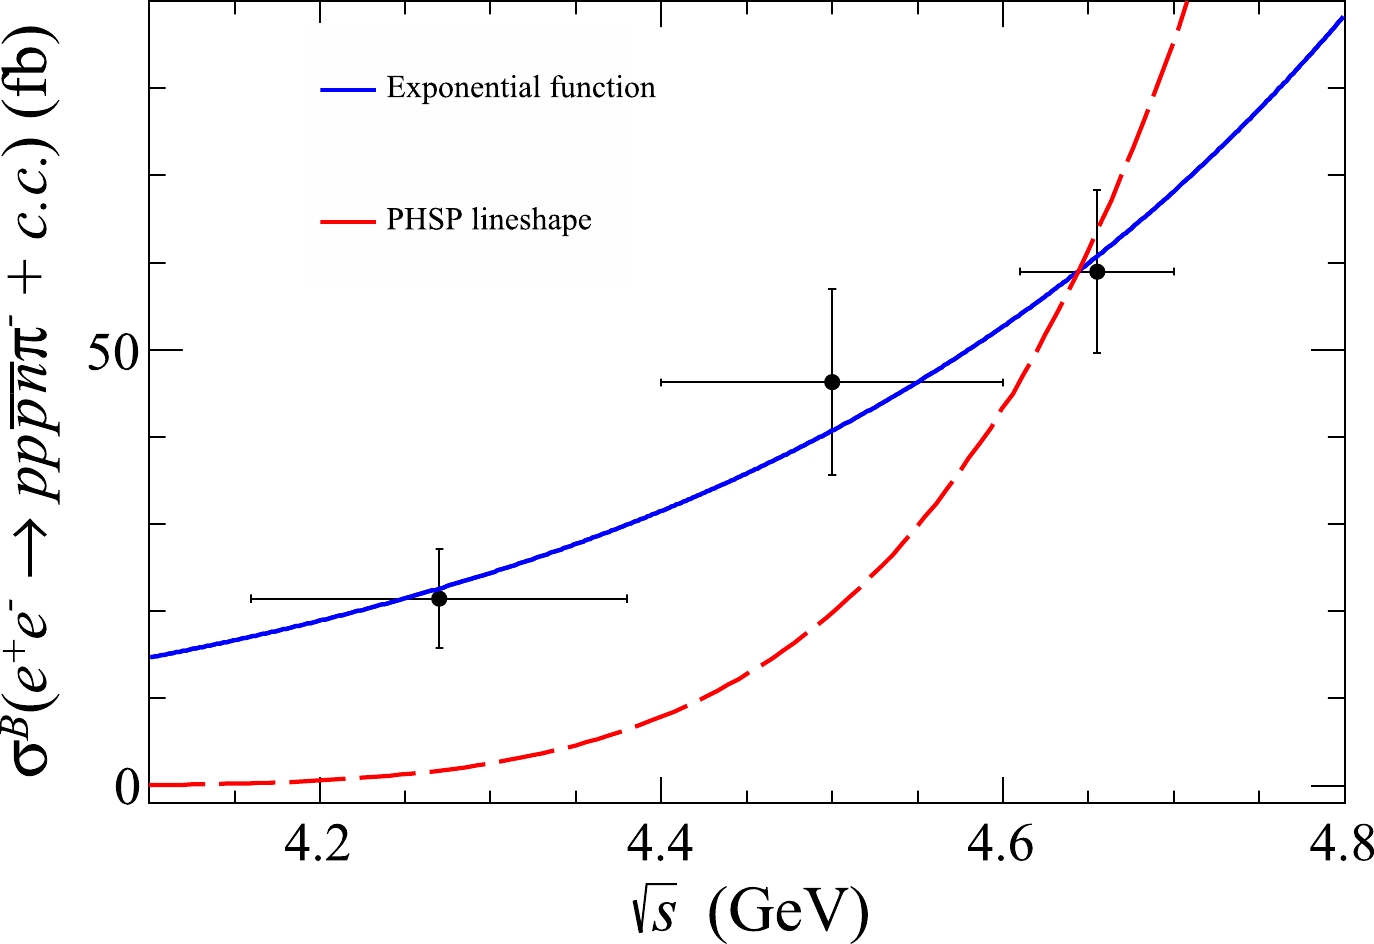
Figure 4. (color online) Average Born cross sections for the process
e^+e^-\to p p \bar{p} \bar{n} \pi^{-} + c.c. . The dots with error bars are the measured values, the blue line shows the exponential function curve and the red-dashed line shows the five-body energy-dependent phase spase (PHSP) lineshape curve.The systematic uncertainties in the cross section measurements will be discussed in the next section.
-
In the cross section measurements, the systematic uncertainties mainly comes from the integrated luminosity, tracking efficiency, PID efficiency, ISR correction,
M_{\rm rec} fit, and veto of background events associated with Λ decays.The integrated luminosity of the data set is measured by large-angle Bhabha scattering events, and the uncertainty in the measurement is
1.0 % [21], which is dominated by the precision of the MC generator used for efficiency correction. The tracking and PID efficiencies have been studied with high purity control samples ofJ/\psi\to p\bar{p}\pi^+\pi^- and\psi(3686)\to \pi^+\pi^-J/\psi\to \pi^+\pi^-p\bar{p} decays [36, 37]. The differences of the tracking and PID efficiencies between data and MC simulation in different transverse momentum and total momentum ranges are obtained separately. The averaged differences for the tracking (PID) efficiencies are corrected by the factorsf_{\rm trk} (f_{\rm PID} ) as mentioned in Sec. IV. The uncertainties of the tracking and PID efficiencies are reweighted by the p/\bar{p} and\pi^{+} /\pi^{-} momenta of the signal MC simulation events. The reweighted uncertainties for tracking (PID) efficiencies,0.1 % (0.3 %) per p,0.1 % (0.4 %) per\bar{p} ,1.0 % (0.5 %) per\pi^{+} and0.8 % (0.4 %) per\pi^{-} , are assigned as the systematic uncertainties. Adding them linearly gives the total systematic uncertainties due to the tracking and PID efficiencies to be1.1 % and1.6 % for the processe^+e^-\to p p \bar{p} \bar{n} \pi^{-} , and1.3 % and1.9 % for the processe^+e^-\to p \bar{p} \bar{p} n \pi^{+} , respectively.The input Born cross sections in the generator are iterated until the
(1+\delta^{\gamma}) \cdot \epsilon values converge. The largest difference of(1+\delta^{\gamma}) \cdot \epsilon between the last two iterations at all energy points,3.2 %, is taken as the corresponding systematic uncertainty.Three different tests were performed to estimate the uncertainty associated with the
M_{\rm rec} fit. The fit range is increased or decreased by5 MeV/c^2 . The background shape is replaced with a second-order Chebychev polynomial function, and the signal shape is replaced with an MC simulation-derived shape. The quadrature sum of these changes,3.6 %, is taken as the relevant uncertainty.The systematic uncertainty due to the veto of Λ background events is estimated by changing the Λ veto mass window from
\pm3\sigma to\pm5\sigma , where σ is the invariant mass resolution and the value is 3 MeV/c^2 . The change of the measured cross section,0.03 %, is assigned as the uncertainty.Adding the above systematic uncertainties summarized in Table 2 in quadrature yields the total systematic uncertainties of
5.3 % and5.4 %, for the processese^+e^-\to p p \bar{p} \bar{n} \pi^{-} ande^+e^-\to p \bar{p} \bar{p} n \pi^{+} , respectively. The average systematic uncertainty,5.35 %, is taken as the total systematic uncertainty in the cross section measurement for the processe^+e^-\to p p \bar{p} \bar{n} \pi^{-}+c.c. .Mode \mathcal{L} 

Trk PID ISR Fit Λ veto \rm Total 

p p \bar{p} \bar{n} \pi^{-} 

1.0 

1.1 

1.6 

3.2 

3.6 

0.03 

5.3 

p \bar{p} \bar{p} n \pi^{+} 

1.0 

1.3 

1.9 

3.2 

3.6 

0.03 

5.4 

Table 2. The relative systematic uncertainties (in %) from the integrated luminosity of data set (
\mathcal{L} ), the tracking efficiency (\rm Trk ), the PID efficiency (PID), the ISR correction (ISR), theM_{\rm rec} fit (Fit), and the Λ veto in the cross section measurements. -
By using the data sets taken at the center-of-mass energies between
4.16 and4.70 GeV, the processe^+e^- \to p p \bar{p} \bar{n} \pi^{-} + c.c. has been observed for the first time with a statistical significance of11.5\sigma . The average Born cross sections in the three energy ranges of (4.160, 4.380), (4.400, 4.600) and (4.610, 4.700) GeV are measured to be(21.5\pm5.7\pm1.2) fb,(46.3\pm10.6\pm2.5) fb and(59.0\pm 9.4\pm 3.2) fb, respectively, where the first uncertainties are statistical and the second systematic. The shape of the invariant-mass spectra of\bar{p}\bar{n} andpp\pi^- are in good agreement with the phase-space distributions, thereby indicating no hexaquark or di-baryon state observed with the current data sample size. -
The BESIII collaboration thanks the staff of BEPCII and the IHEP computing center for their strong support.
Observation of { {\boldsymbol e^+\boldsymbol e^- \to\boldsymbol p\boldsymbol p \bar{\boldsymbol p} \bar{\boldsymbol n} \boldsymbol\pi^{-} + \boldsymbol c.\boldsymbol c. }}
- Received Date: 2022-11-25
- Available Online: 2023-04-15
Abstract: Using data taken at 29 center-of-mass energies between 4.16 and 4.70 GeV with the BESIII detector at the Beijing Electron Positron Collider corresponding to a total integrated luminosity of approximately 18.8


 DownLoad: