-
The Large High Altitude Air Shower Observatory (LHAASO) [1] is a complex of extensive air shower (EAS) detector arrays, located at Mt. Haizi (29°21'27.6" N, 100°08'19.6" E) at an altitude of 4410 m above sea level (a.s.l.), in an area at the edge of the Qingzang plateau near Daocheng, Sichuan Province, China. It consists of an EAS detector array covering an area of 1.3 km2 (KM2A) with 5195 scintillator counters (EDs, 1 m2 active area) and 1188 muon detectors (MDs, water Cherenkov detector with an area of 36 m2 buried under 2.5 meters of dirt). In the center of the array are the Water Cherenkov Detector Array (WCDA) covering 78,000 m2 and the Wide Field-of-view Air Cherenkov/Fluorescence Telescope Array (WFCTA) consisting of 18 telescopes. The LHAASO is designed for the detection of air showers induced by all kinds of cosmic-ray particles, with energies ranging from a few tens of GeV to a few EeV, and for very effectively identifying gamma rays out of the charged cosmic-ray background. LHAASO is therefore a multi-purpose facility for very-high-energy gamma ray astronomical observation, cosmic-ray energy spectrum measurements for individual species, and other wide-ranging topics associated with cosmic-rays or air-shower phenomena. For the gamma-ray source survey, the designed sensitivity is approximately 0.01 CU (Crab Units). Its wide FoV allows the LHAASO to survey 1/7 of the northern sky at any moment for gamma-ray sources. With operation in the full duty cycle, the LHAASO scans the entire northern hemisphere every 24 h. The spectra of all sources in its FoV are measured with high precision over a wide energy range, from
$ 10^{11} $ eV to$ 10^{15} $ eV. These measurements, particularly above 100 TeV, will offer a great opportunity for finding cosmic-baryon PeVatrons and thereby identifying cosmic-ray origins among the gamma-ray sources. The Cherenkov/fluorescence telescopes of WFCTA are used to record the longitudinal development of air showers that trigger the arrays on the ground. The combined detection of showers using all detectors in the LHAASO enables the identification of the cosmic-ray species, at least for protons, H+He, and iron nuclei, with an aperture greater than 4000 m$ ^2\cdot $ sr. The knees of the spectra of cosmic rays are expected to be measured at energies above 100 TeV for individual mass groups.The Water Cherenkov Detector Array (WCDA), mostly used for surveying transient phenomena and discovering new sources, has been constructed in three phases. The first, denoted WCDA-1, is a square pond of 150 m
$ \times $ 150 m consisting of 900 detector units. It was completed in April 2019 and has been in operation since then. In the second phase, another pond of the same size, referred to as WCDA-2, has been in operation since November 2019. The third pond, WCDA-3, with a size of 300 m$ \times $ 110 m, began operation at the beginning of 2021. For gamma-ray induced showers, WCDA-2 and WCDA-3 have a threshold below 100 GeV because they use a 20" PMT in each unit, while 600 GeV is the threshold for WCDA-1 because an 8" PMT is installed in each unit. Here, the threshold is the energy above which the detector can observe the Crab Nebula as a standard candle at 5 sigma level in one-year.In this paper, the performance of WCDA-1 is thoroughly studied using the data acquired from April 2019 to March 2020. The experiment, including the detector configuration and the calibration for both timing and charge measurements, is described in the second section. Details regarding the observation of the Crab Nebula as a standard candle are described in the third section, including the shower geometric reconstruction, the cosmic-ray background suppression, and the angular resolution. Details about the air shower and detector response simulation and the gamma-ray shower energy reconstruction are discussed in the fourth section. Measurement of the spectral energy distribution of the Crab Nebula is described along with the systematic uncertainties in the fifth section. A short summary follows at the end of the paper.
-
WCDA-1 is composed of 900 detector units that are optically separated by non-reflecting black plastic curtains. Each unit is a 5 m
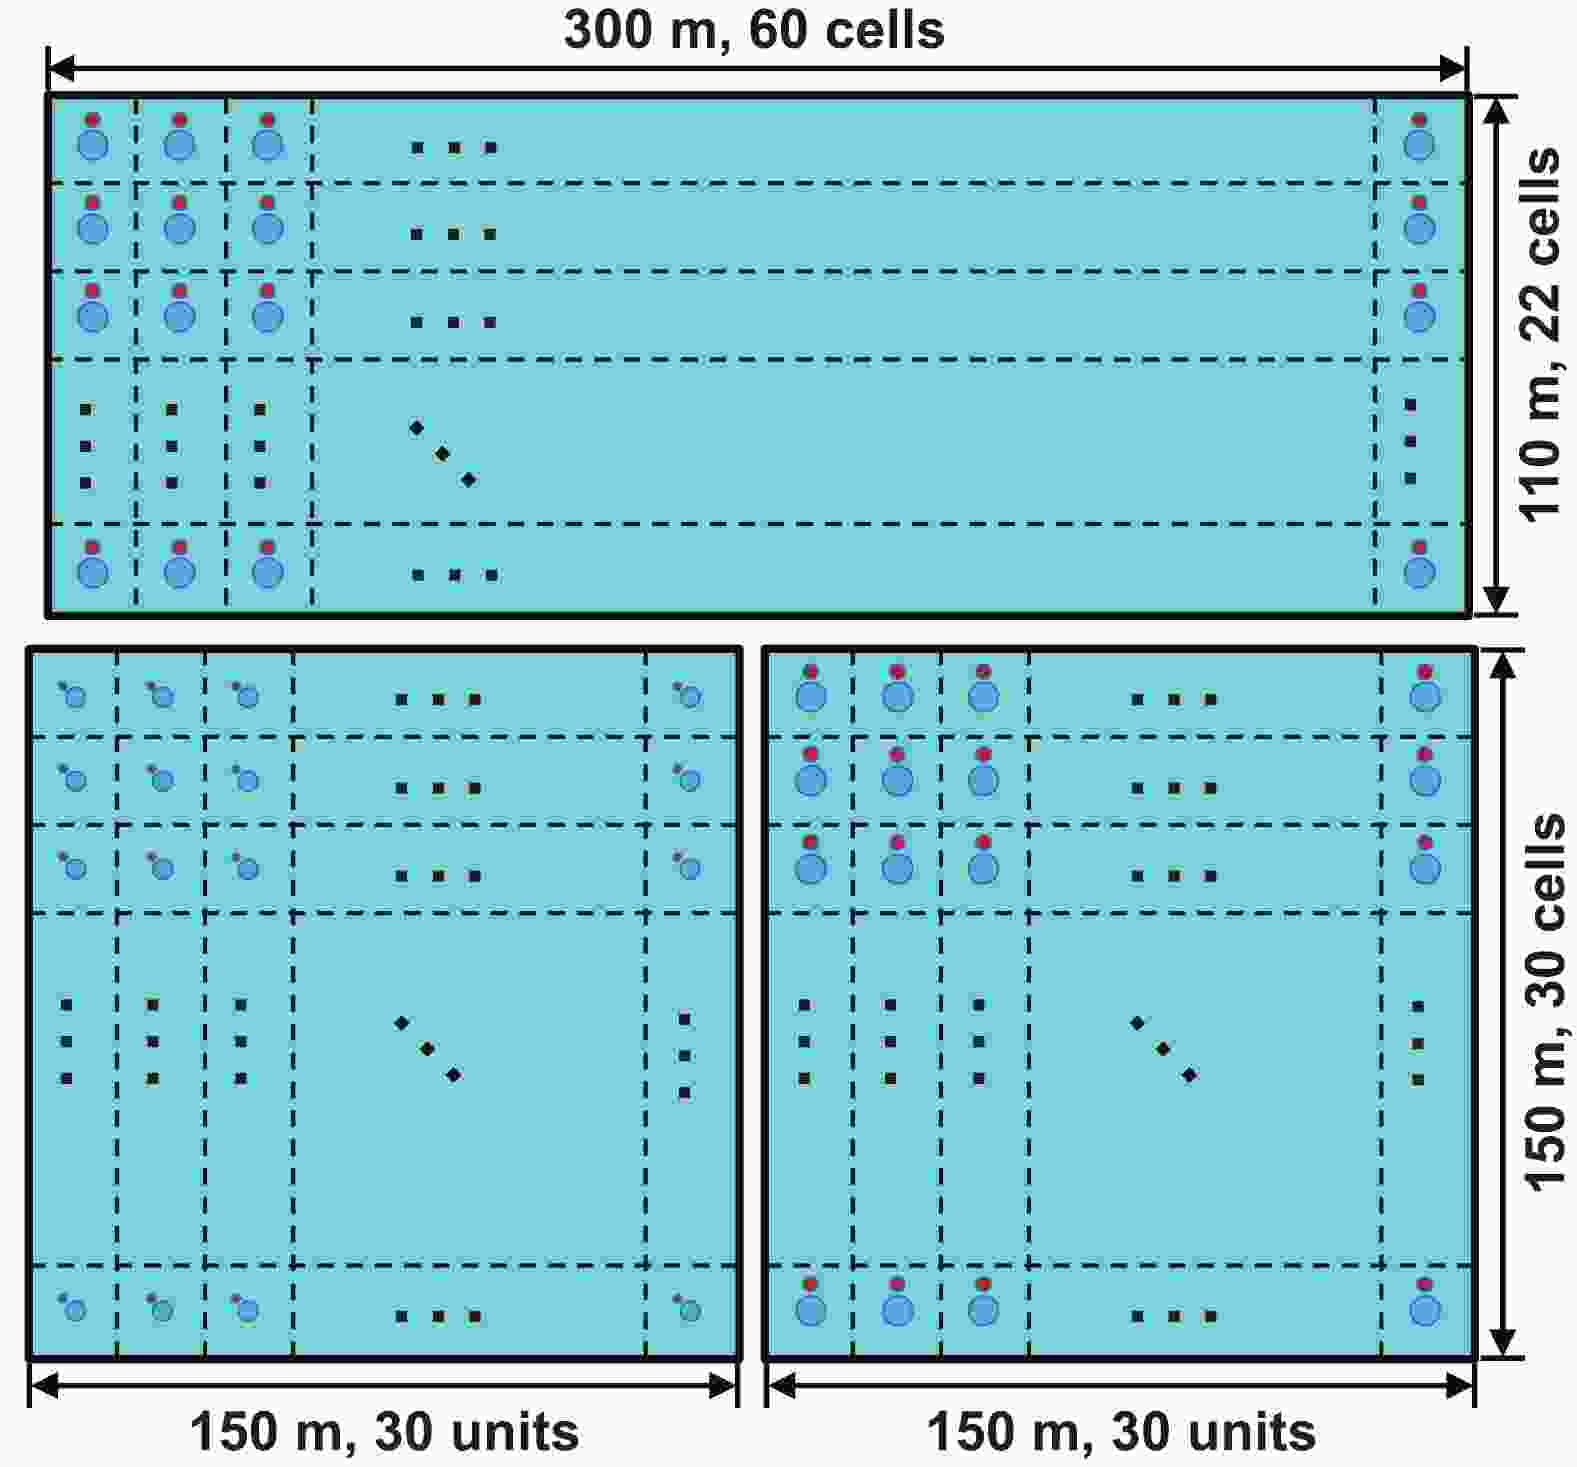
$ \times $ 5 m cell equipped with two upward-facing PMTs on the bottom at the center of the unit. The pond is filled with purified water up to 4 m above the photo-cathodes of the PMTs, with a total volume of approximately 100,000 cubic meters. This is the first completed detector array out of three, as illustrated in the layout in Fig. 1. The inner surface of the pond is covered with high density polyethylene (HDPE) film with a thickness of 2 mm to guarantee a daily leakage rate of less than 0.02% of the total water capacity.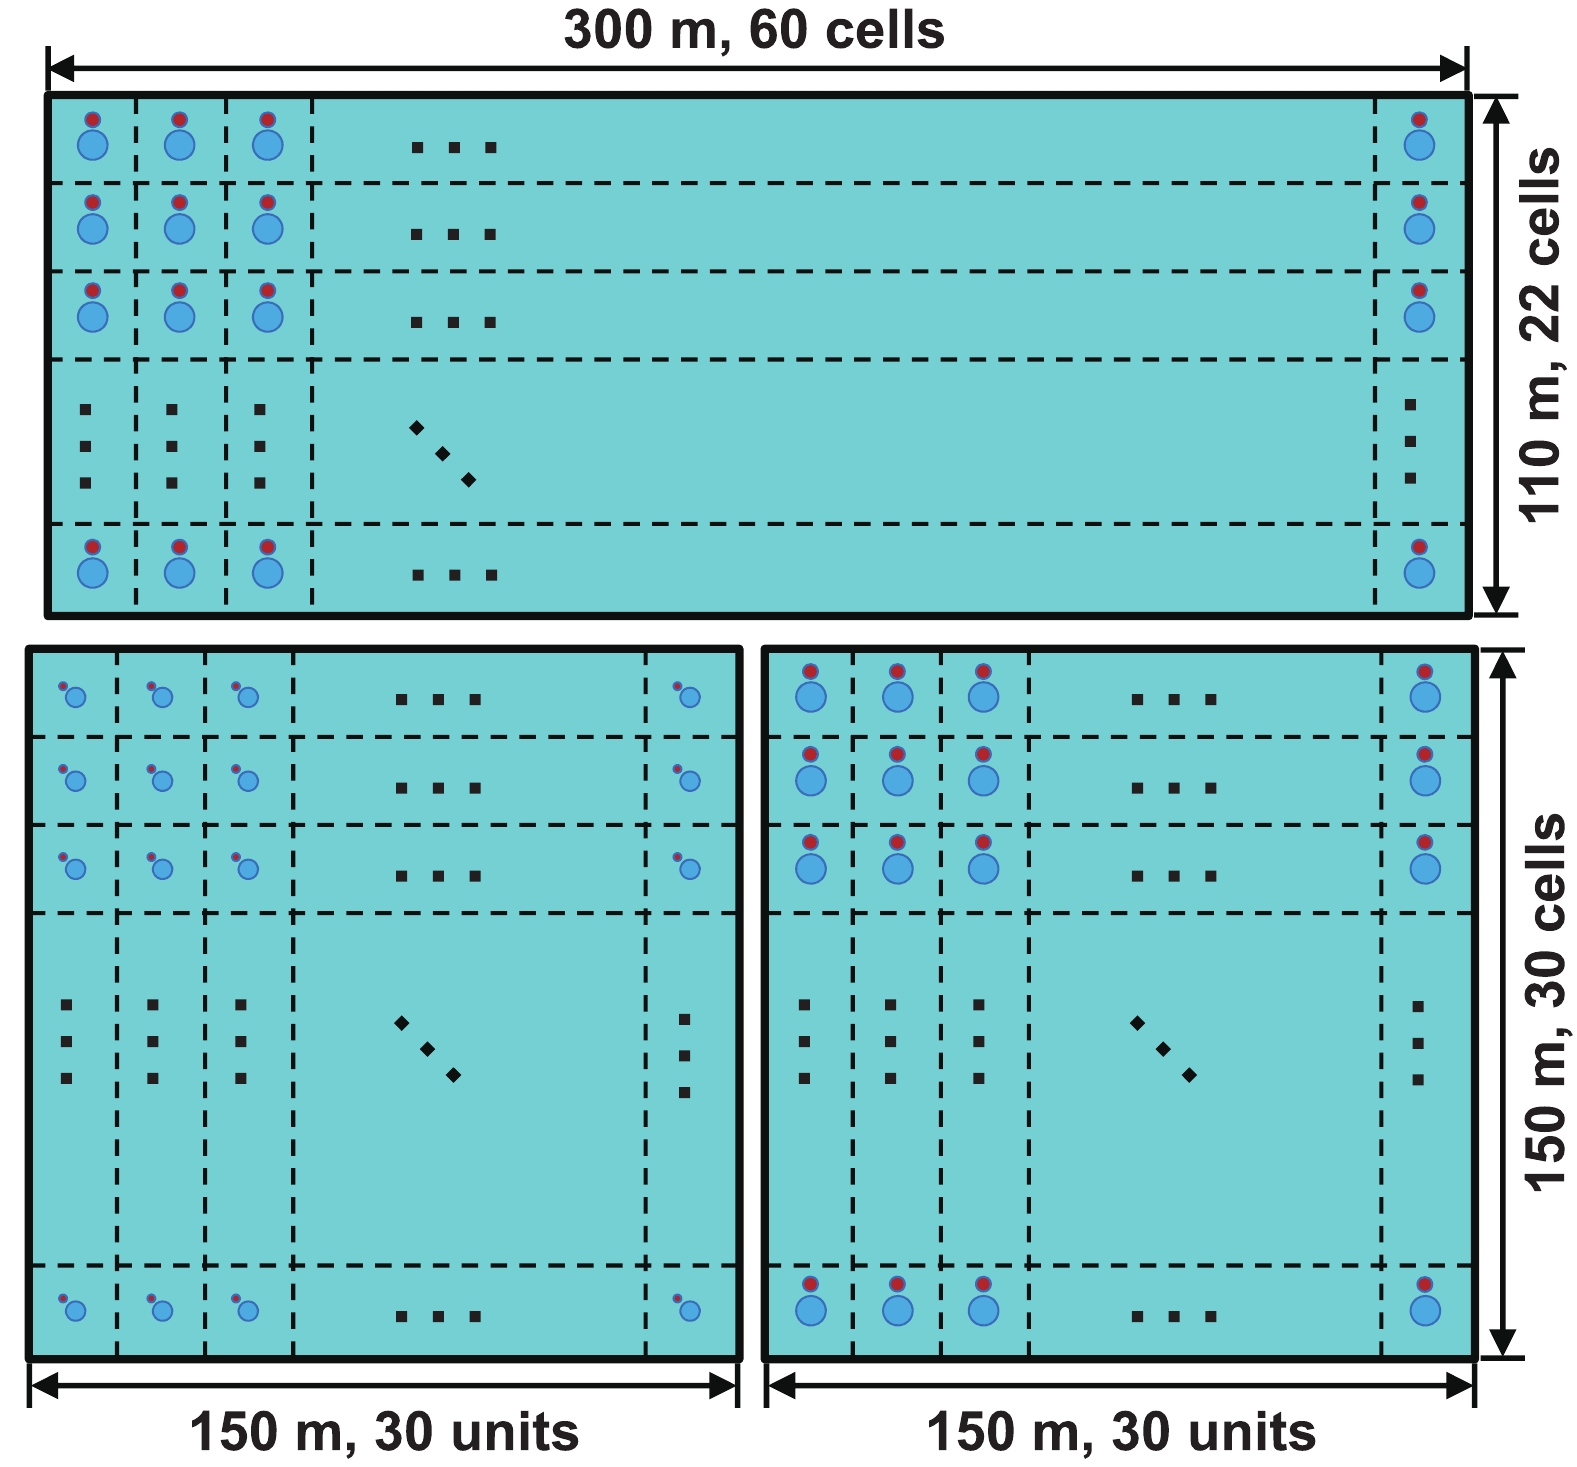
Figure 1. (color online) Schematic of the WCDA layout. The lower two ponds are WCDA-1 and WCDA-2 from left to right, respectively, and the upper one is WCDA-3. The two dots in each detector unit indicate the PMTs, while the dashed lines represent the curtains between units. Two combinations of PMTs are used: 8" and 1.5" PMTs in WCDA-1, and 20" and 3" PMTs in WCDA-2 and WCDA-3.
To maintain an attenuation length for near-ultra violet light longer than 15 m, the water needs to be purified continuously. This is accomplished with a closed recycling loop. Water is sucked out from one side and filled back in on the opposite side of the pond after purification with bacterium/organic-carbon killing and filtering. The entire volume is recycled every 15 days.
In Fig. 1, the two dots in each unit indicate PMTs of 8" and 1.5", respectively, used in WCDA-1. The combination of the two covers a wide dynamic range in terms of the number of photoelectrons (PEs), from 1 to 200,000. This configuration allows a better measurement of the particle density distribution in the shower cores without saturation, even for very energetic showers up to 10 PeV. It also allows the shower core location to be reconstructed with a resolution of better than 3 m for energetic events of 10 TeV and greater. This greatly improves the shower energy resolution for those events. It is useful for high precision measurements of the spectral energy distribution (SED) of gamma-ray sources in the overlapping region with the LHAASO-KM2A, and it is essential for measuring the charged cosmic-ray spectrum in the combined experiment with the LHAASO-WFCTA. An event detected by both large and small PMTs is shown in Fig. 2. It clearly shows how the combination of the charge measurements (in units of PE) from the two PMTs correctly measures the lateral distribution for high energy showers.
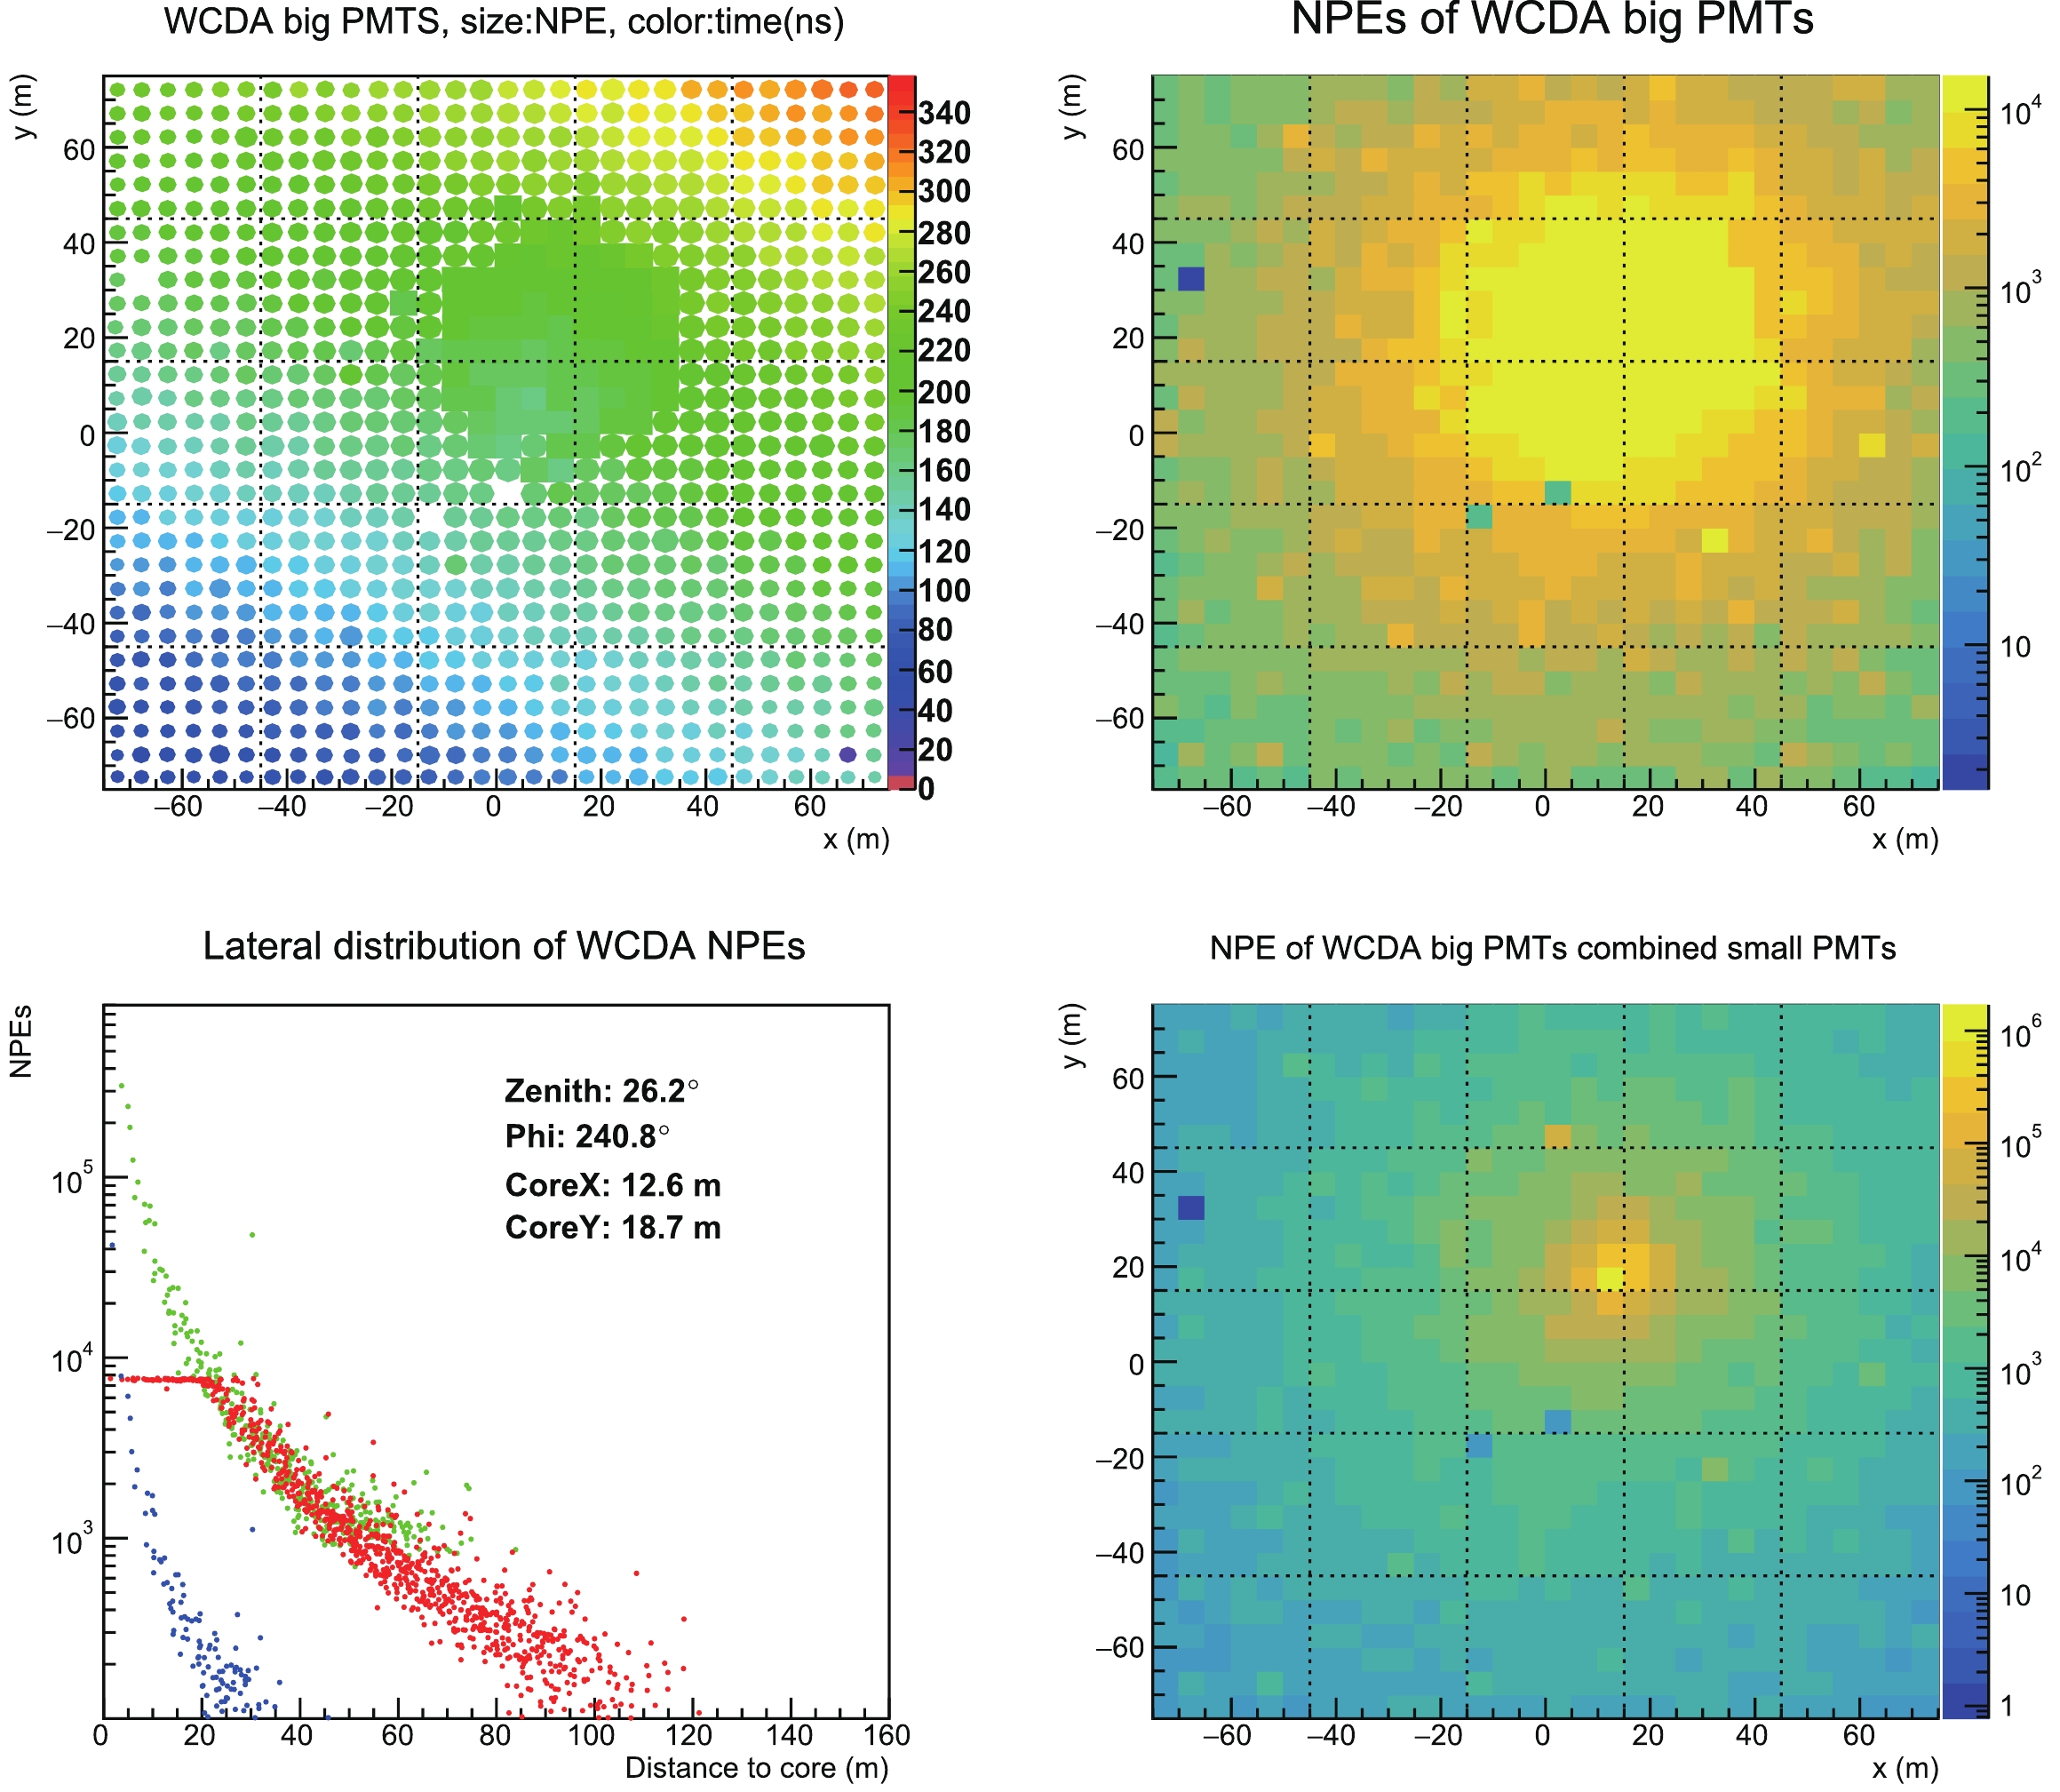
Figure 2. (color online) A typical high energy shower event detected by WCDA-1. The top left panel shows the arrival time of the shower front at each cell. The units on the color scale are ns. The top right panel shows the number of photoelectrons, NPE, recorded by the 8" PMT in each cell (bin), in which many saturated PMTs can be seen. To improve the measurement of the core region, the two maps are combined, as shown in the lower left panel, where the lateral distribution, measured in equivalent NPE, of the small PMTs (blue points represent its original measurement and green points represent the charge equivalent to the charge that would be measured by the 8" PMT) is overlaid to that of the large PMTs (red points) to construct a distribution over the entire dynamic range. The lower right panel shows the same event, where the information of the 2 PMTs is combined.
The 8" PMTs are read out from both the anode and the last dynode as two independent signals with a gain difference of a factor of approximately 48. Two 12-bit ADC channels are used to digitize both signals and achieve a dynamic range from 1 PE to 5000 PE with a non-linearity of less than 1.5% and a charge resolution of 35% for single PE and 2% for signals greater than 200 PE. The anode signal is amplified and fed into a discriminator to measure the trigger time. A timing resolution of 1 ns has been achieved, sufficient to reconstruct the shower front conical structure. The 900 units in WCDA-1 are divided into 25 groups of 36 units (72 PMTs), each connected to a single electronic box, which provides the power and hosts all electronics boards.
The White Rabbit Protocol (WR) [2] is used to distribute the clock and ensure the synchronization of each detector unit within 200 ps through a fiber network over the entire LHAASO array. In the central timing station, a rubidium oscillator synchronized with GPS/BeiDou Time (BDT) is used as the source of the clock, which is distributed to the entire array through the WR network. Data collected from each PMT are transmitted to the data station of WCDA-1 through the same fiber network. The same is true for any other LHAASO detector, where the same network is used for synchronization and data readout. In WCDA-1, the correct synchronization of the 36 large PMTs, used for timing measurements within each cluster, is achieved with the dedicated calibration described below.
A hit is formed with a threshold of 1/3 PE for a 8" PMT and recorded with the absolute time stamp from the WR system, and the charges are simultaneously measured by the 8" PMT and 1.5" PMT. The stream of hits is transmitted to the data acquisition (DAQ) computers and buffered for 30 s before being discarded. The hits are sorted by time and fed into the triggering and event building algorithm. This maximizes the flexibility by allowing many trigger algorithms to run in parallel. Built events are stored for further analysis in specific data streams according to the trigger algorithms.
-
In the WCDA-1 architecture, 900 units are divided into 25 groups. The 36 8" PMTs in each group are connected to an electronic box, which is synchronized with the WR system. To calibrate the 36 PMTs in a group, an optical fiber bundle is illuminated by a LED and used to distribute synchronized light pulses to every PMT in the group. The LED is driven by a pulse generator installed in the electronics box. Before routing the fibers to the PMTs, the arrival time of the light pulse generated by the LED through each fiber is measured [3] in a lab with an accuracy of better than 100 ps. The time differences between fibers are shown in Fig. 3(b) as a distribution with a root mean square (RMS) of 163 ps among 1800 fibers. To check the synchronization between the different groups, another bundle of 36 fibers is also installed in each group. Twenty fibers of this bundle are used to illuminate 20 PMTs belonging to the group, and the remaining 16 fibers illuminate four PMTs in each of the four adjacent groups, as shown in Fig. 3(a). The RMS time offsets measured between adjacent groups is 200 ps. This confirms the synchronization accuracy achieved using the WR system.
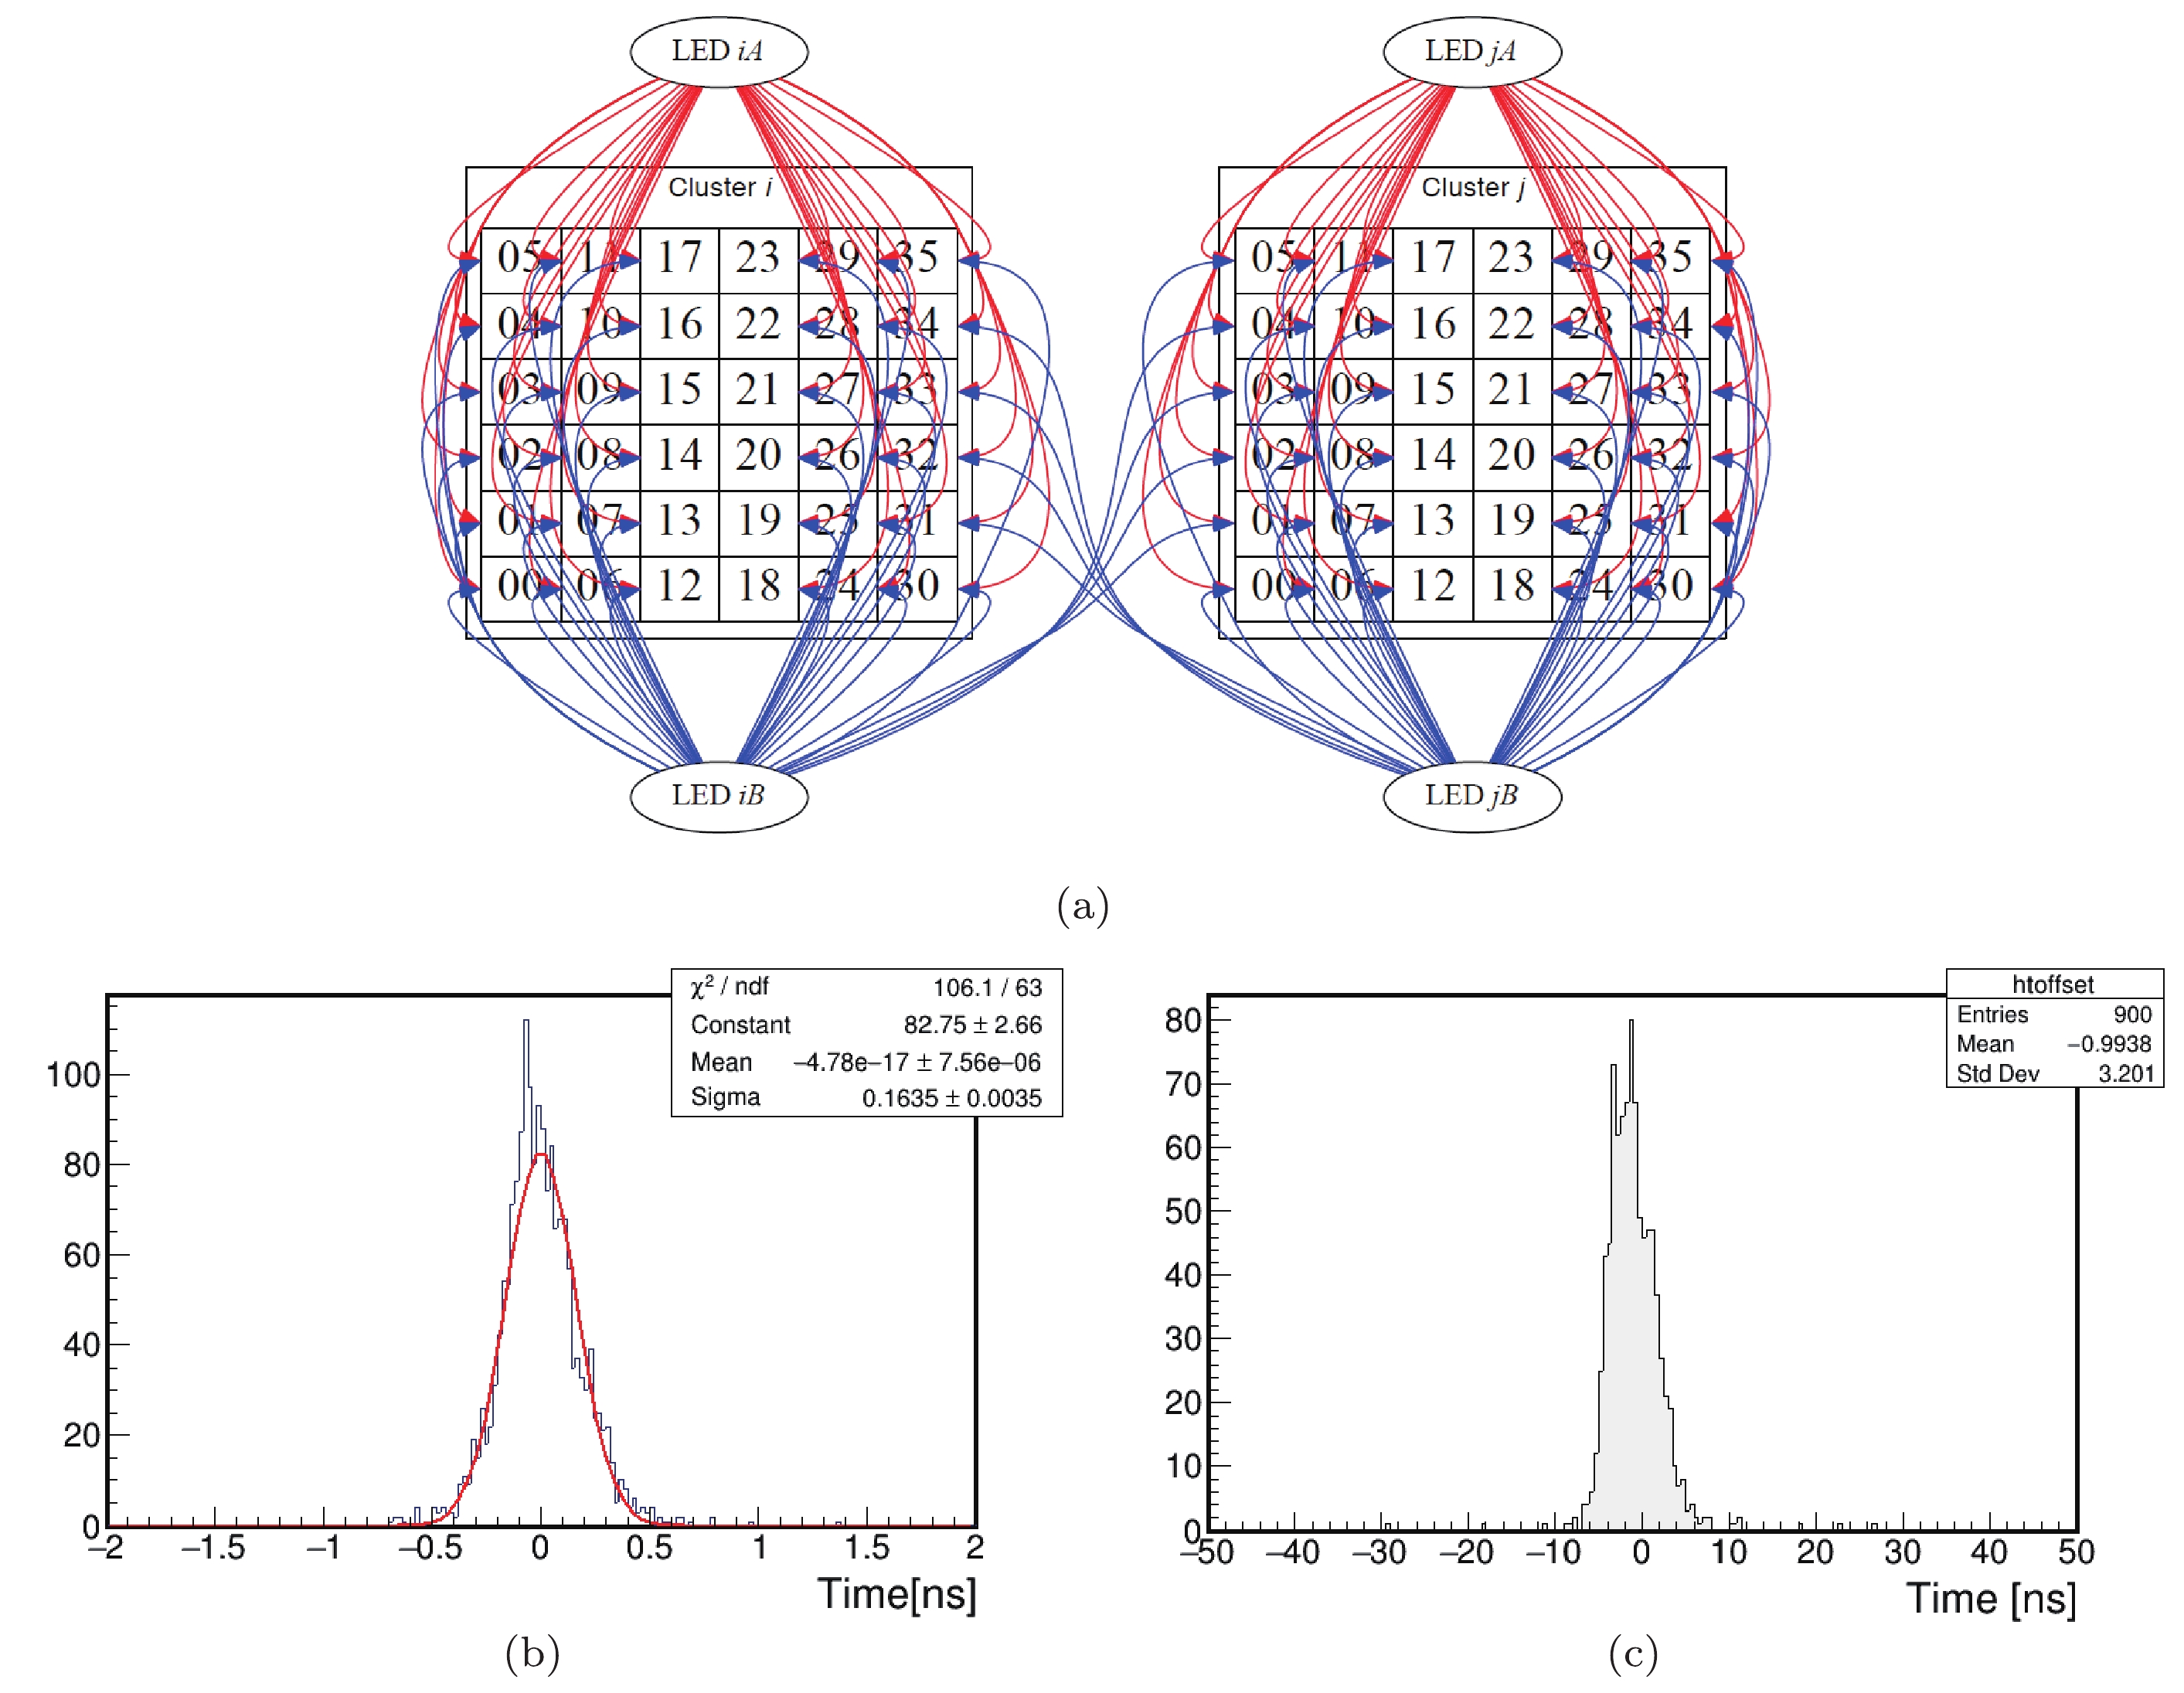
Figure 3. (color online) (a) Sketch map of time cross calibration. (b) Distribution of the time offset for 1800 fibers used in the calibration system of WCDA-1. (c) Distribution of the time spread among the 900 units of WCDA-1.
Calibration using the fiber network has been carried out at the site several times, including the first instance during the ‘dry-run’ before water filling and those in March, April, May, August, and October 2019. The distribution of time offsets measured in the last calibration run is shown in Fig. 3(c). The RMS of the offsets is 3.2 ns among the 900 PMTs. The calibration data and the calibration system have proven to be very stable over time. The time offsets are very stable, with a maximal variation less than 0.2 ns among 900 PMTs over all the calibrations for eight months.
As mentioned above, the 8" PMT is read out from both the anode and the last dynode to cover a range from 1/3 PE to 5000 PE. The charge calibration of the anode signal is straightforward, involving measuring the single PE peak position of the ADC count distribution for each PMT. The resolution of the single PE position, with 25 ADC counts as the typical value, is approximately 32%. The range covered by the anode high gain channel is up to 130 PE, with a non-linearity of less than 5%. The details of the calibration are reported elsewhere [4], in which the measurements of the linearity of every PMT have been summarized. The calibration of the dynode signals is performed by comparing them with the corresponding anode signals in the overlapping region, i.e., above 25 PE. In Fig. 4(a), the dynode signal is plotted against the anode signal in terms of ADC counts for a typical PMT. Saturation exists when the anode signal exceeds 4096. The ratio between the two signals, denoted
$ A/D $ , can be extracted by fitting in the region of the anode signals between 500 and 2300 counts. The ratio found,$ A/D = 53.9\pm 0.1 $ , is used as a calibration constant for the PMT. A 2-D map of the 900$ A/D $ ratios of WCDA-1 is shown in the right panel of Fig. 4. To investigate the calibration stability, the single PE peak position and$ A/D $ of all 900 PMTs have been monitored continuously. The temporal variations were found to be within 0.1% and 0.05%, respectively, during April and May 2019.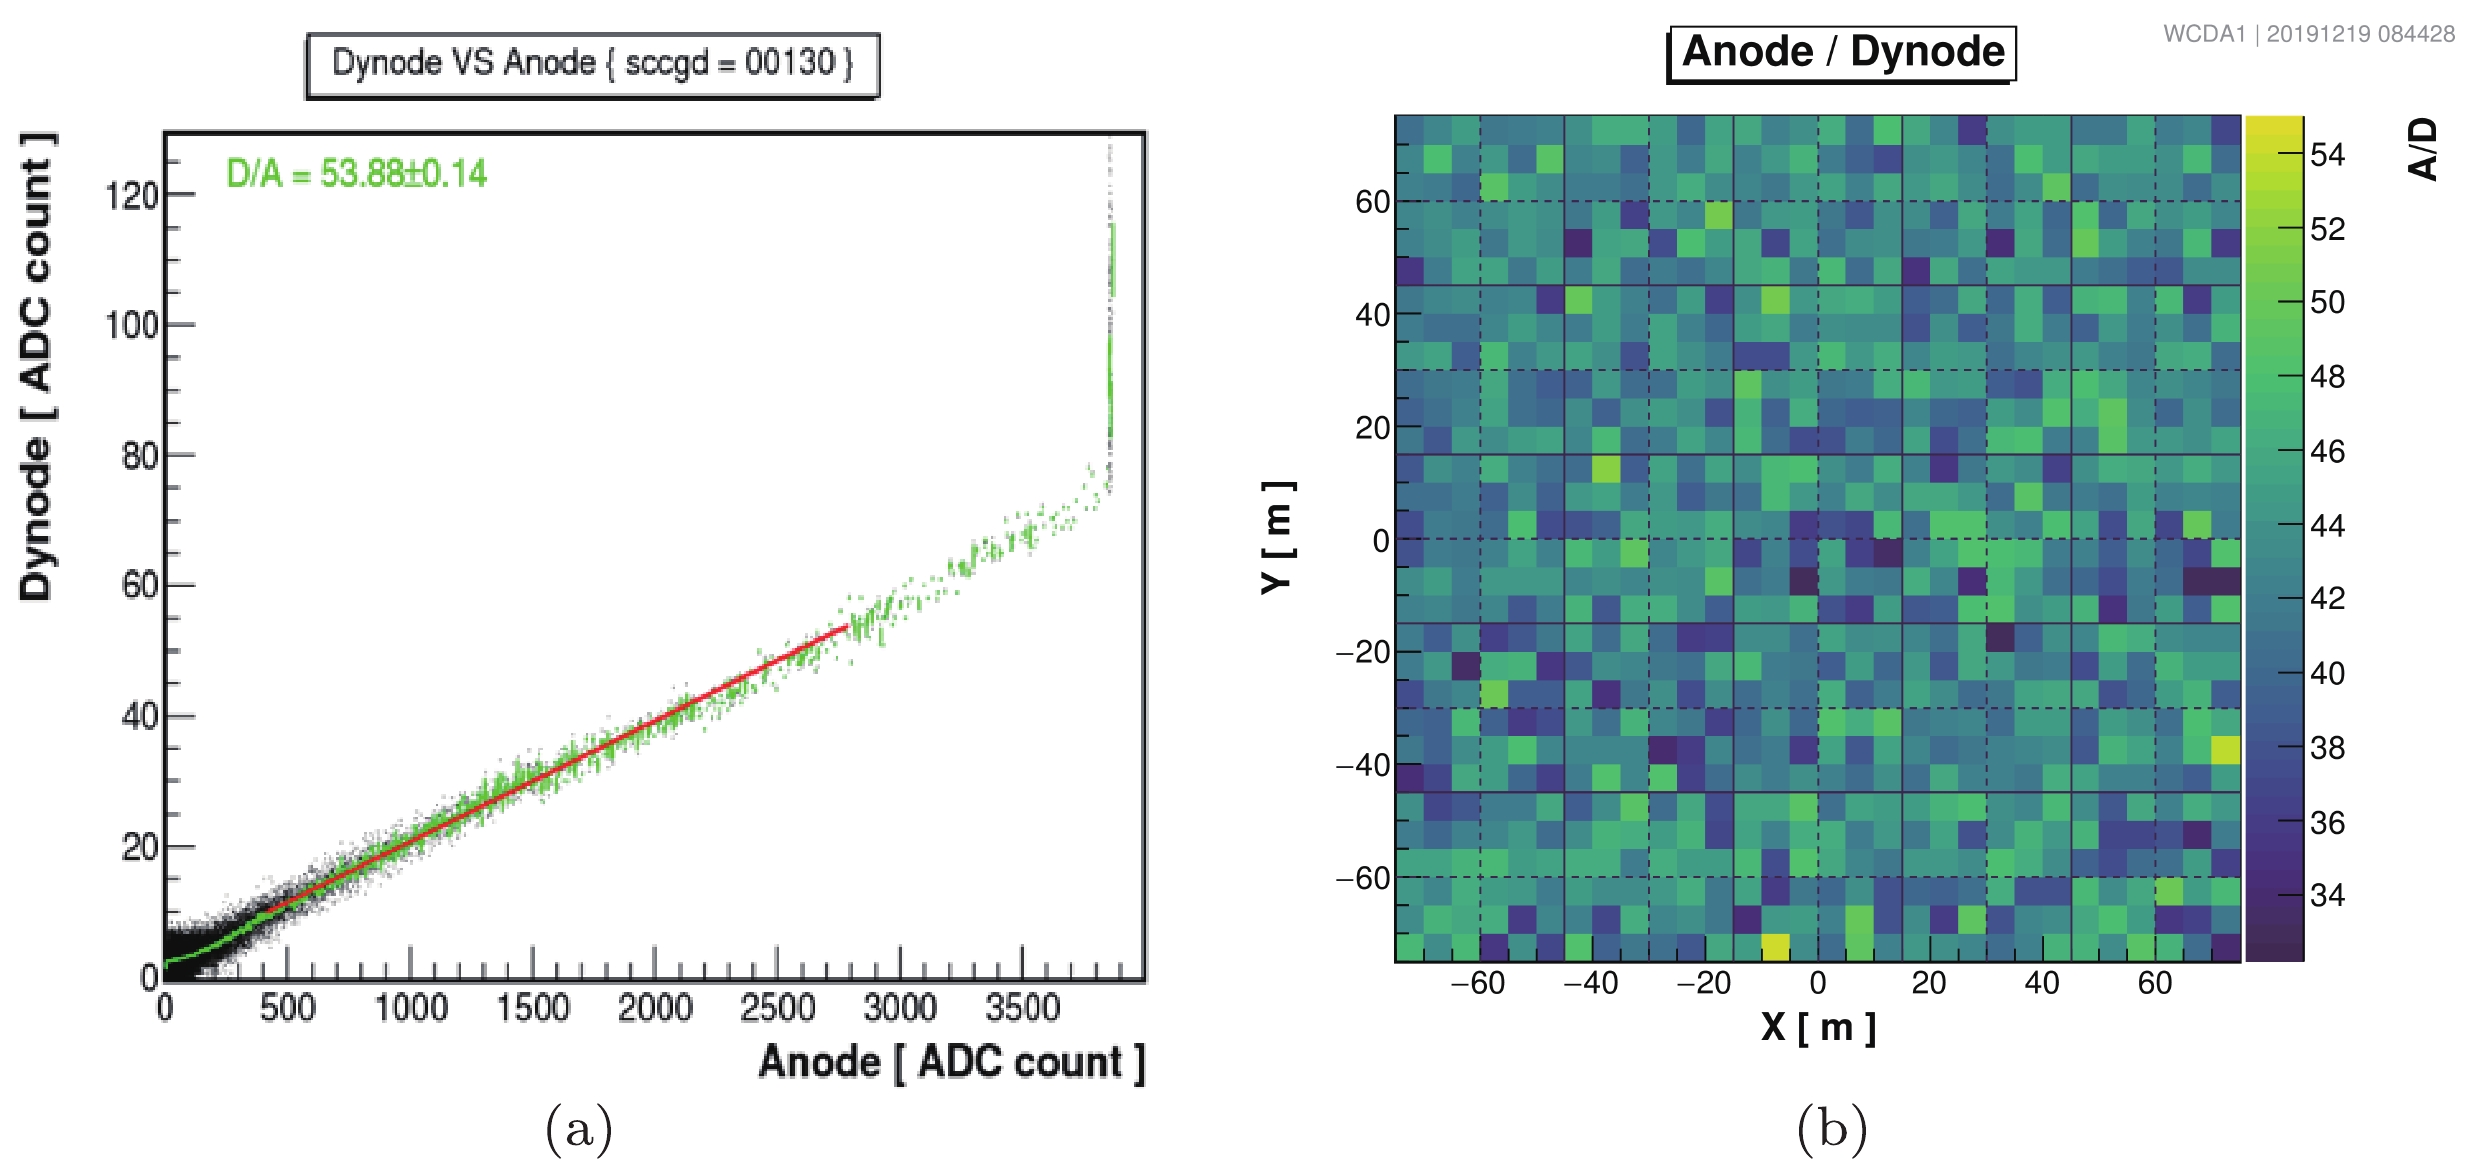
Figure 4. (color online) (a) An example of the amplitude, in ADC counts, of the last dynode versus the anode signal for an 8" PMT. (b) Uniformity over the WCDA-1, as a 2D map, of the measured A/D ratios for all 900 PMTs.
The calibration of 1.5" PMTs has been performed by matching the signals with the 8" PMTs in the overlapping region, i.e., above 500 PE, measured by the 8" PMTs. Figure 5(a) shows an illustrative example of how the ratio of the two signals is extracted with a linear fit in the overlapping region, between 500 and 2300 ADC counts of the 8" PMT, where the non-linearity is below 3%. The ratio is
$ 8.18\pm0.04 $ for the pair of PMTs shown as an example. The distribution of the ratios of all 900 pairs has a width of 17%. The mean value of 9.0 is related to the ratio of the geometrical areas of the photocathodes of the two PMTs and their gains.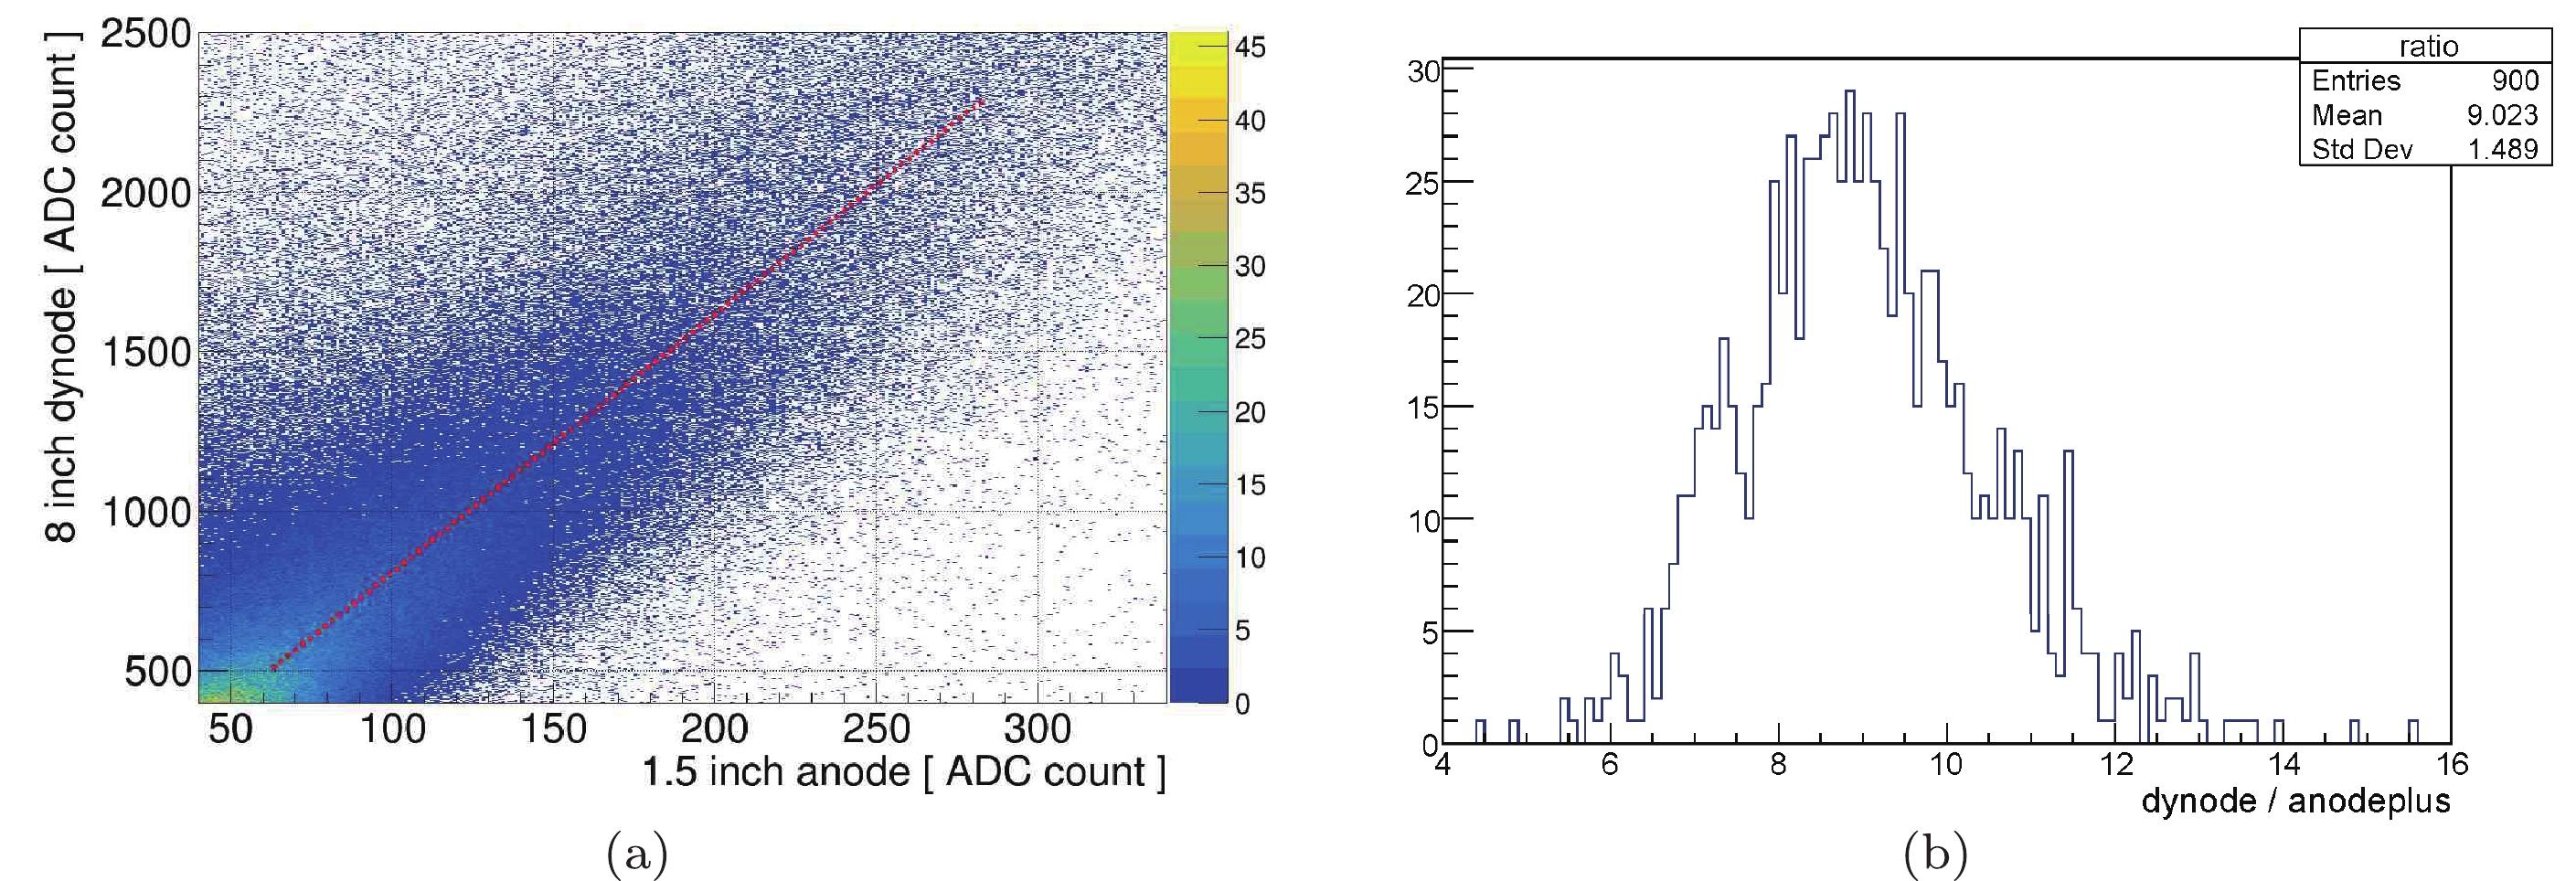
Figure 5. (color online) (a) Amplitude in ADC counts of dynode signal of 8" PMT versus anode signal of 1.5" PMT in a typical PMT unit of the WCDA-1 detector. (b) Measured A/D ratios for all 900 PMTs.
The ‘spectral charge distribution’ of cosmic rays measured by each WCDA-1 unit, i.e.,
$ Q {\rm d}N/{\rm d}Q $ , where Q is the charge measured by the PMT in units of PE and N is the trigger frequency of the unit by cosmic rays, is found to have a clear peak, as shown in Fig. 6 for a typical unit. Based on the Monte Carlo simulation, this result is mostly due to the diffuse energetic single particles that arrive at each unit with a distribution that is uniform and nearly constant from a wide range of directions. Simulation studies show that the peak can be mostly attributed to muons passing by the PMT with a distance of approximately 3 m [5]. The measured charge at the peak indicates a combination of the PMT sensitivity and the transmission of water in the unit. This provides an ideal calibrating beam for WCDA-1 units to measure the uniformity in response of the 900 units and monitor the variation of the calibration with time, e.g., those resulting from changes in water transmission. In the left panel of Fig. 7, the distribution of the charge at peak of 900 units is shown in the 2-D map of WCDA-1. The average charge of 900 peaks was 11.6 PE on Nov. 22, 2019. A distribution with an RMS of 0.6 PE measures the non-uniformity between the units in WCDA-1. The monitoring of the average charge of the peaks shows that the water transmission was continuously changing over the 179 days since Sept. 5, 2019, when WCDA-1 began its stable operation phase. In the right panel of Fig. 7, the average of the charge at peaks has been plotted as a function of time. All of the differences between units and time variations have been corrected with respect to a “standard detector” at Nov. 22, 2019 to maintain the uniformity and stability of the detector, after correcting the drift of the average charge value resulting from the improvement in water transparency.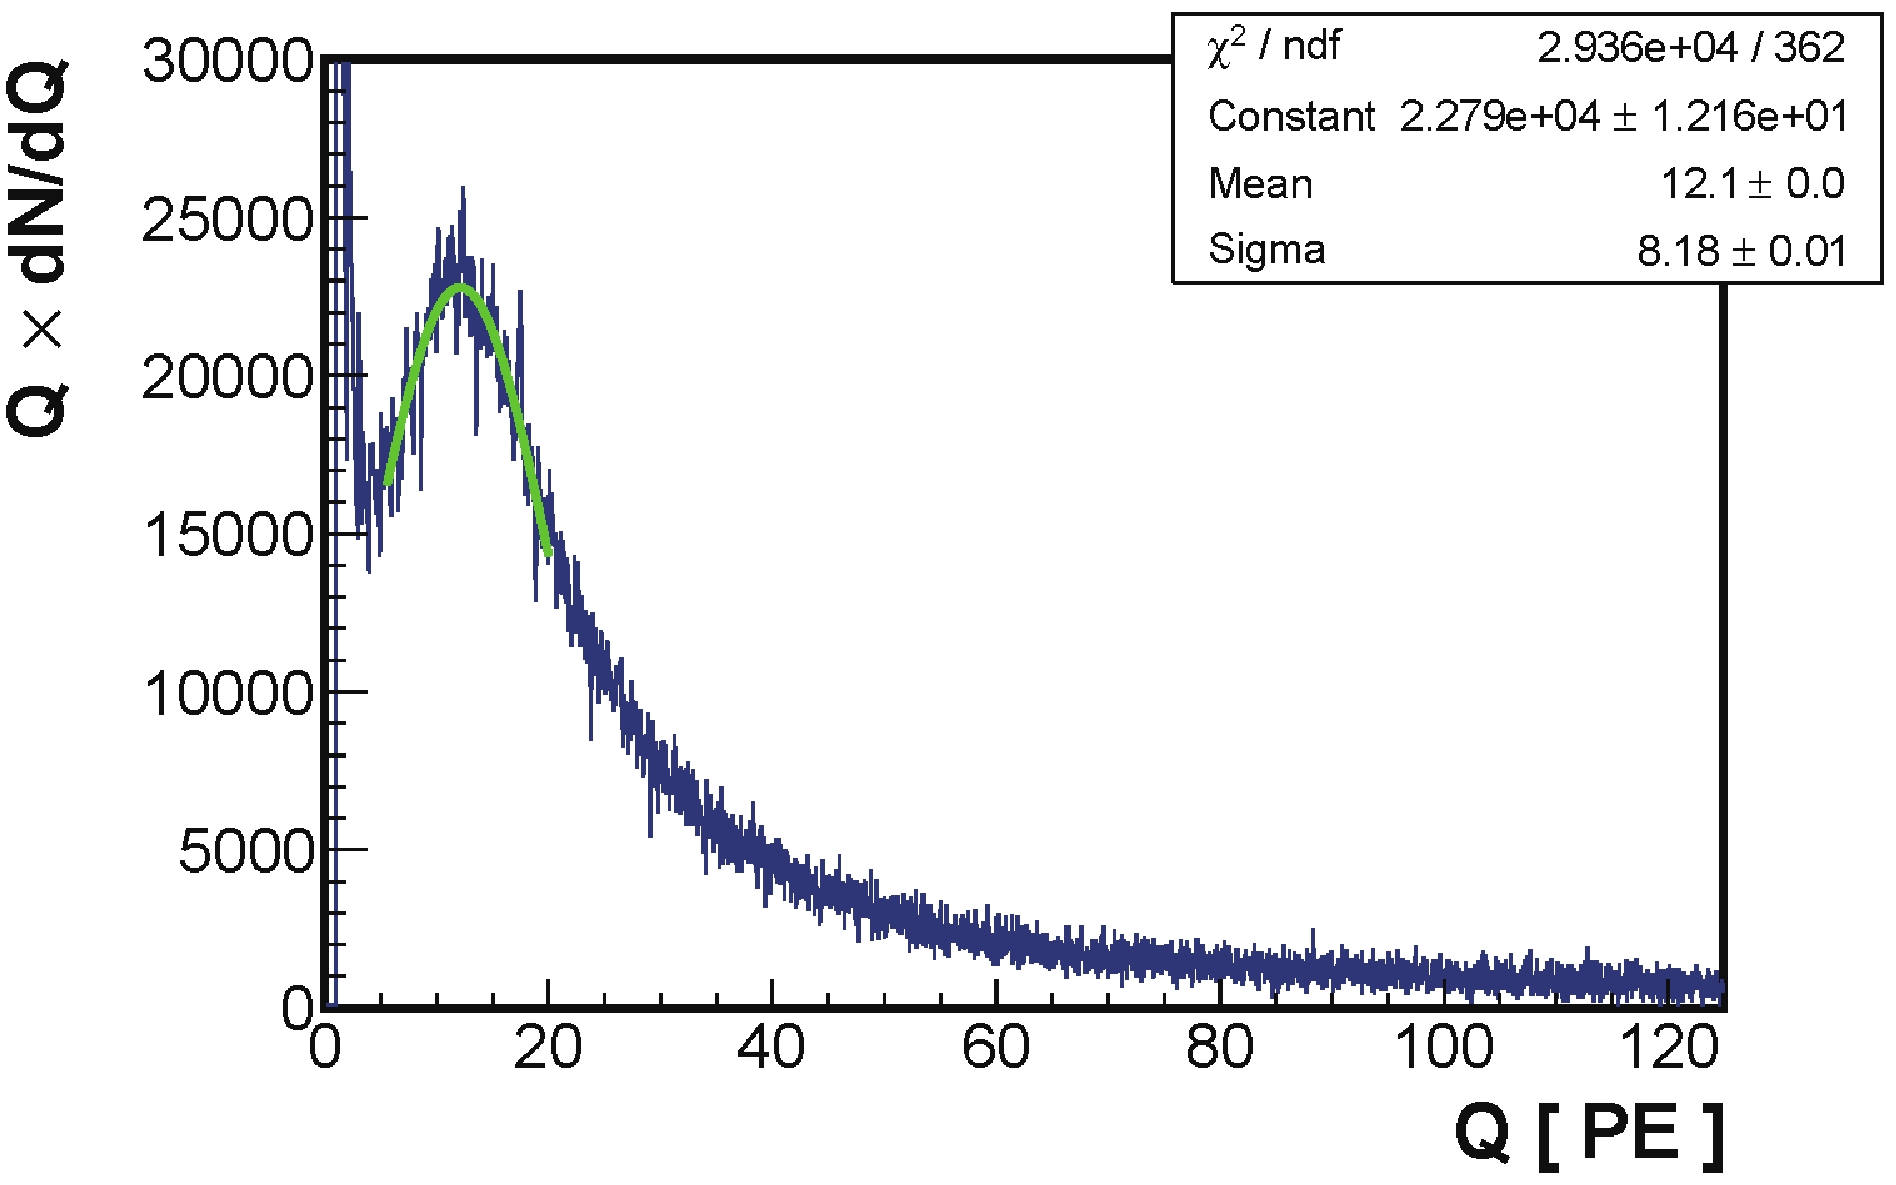
Figure 6. (color online) “Spectral charge distribution” of cosmic rays measured by a typical WCDA-1 unit. The clear “muon peak” is due to diffuse single muons falling in the unit.
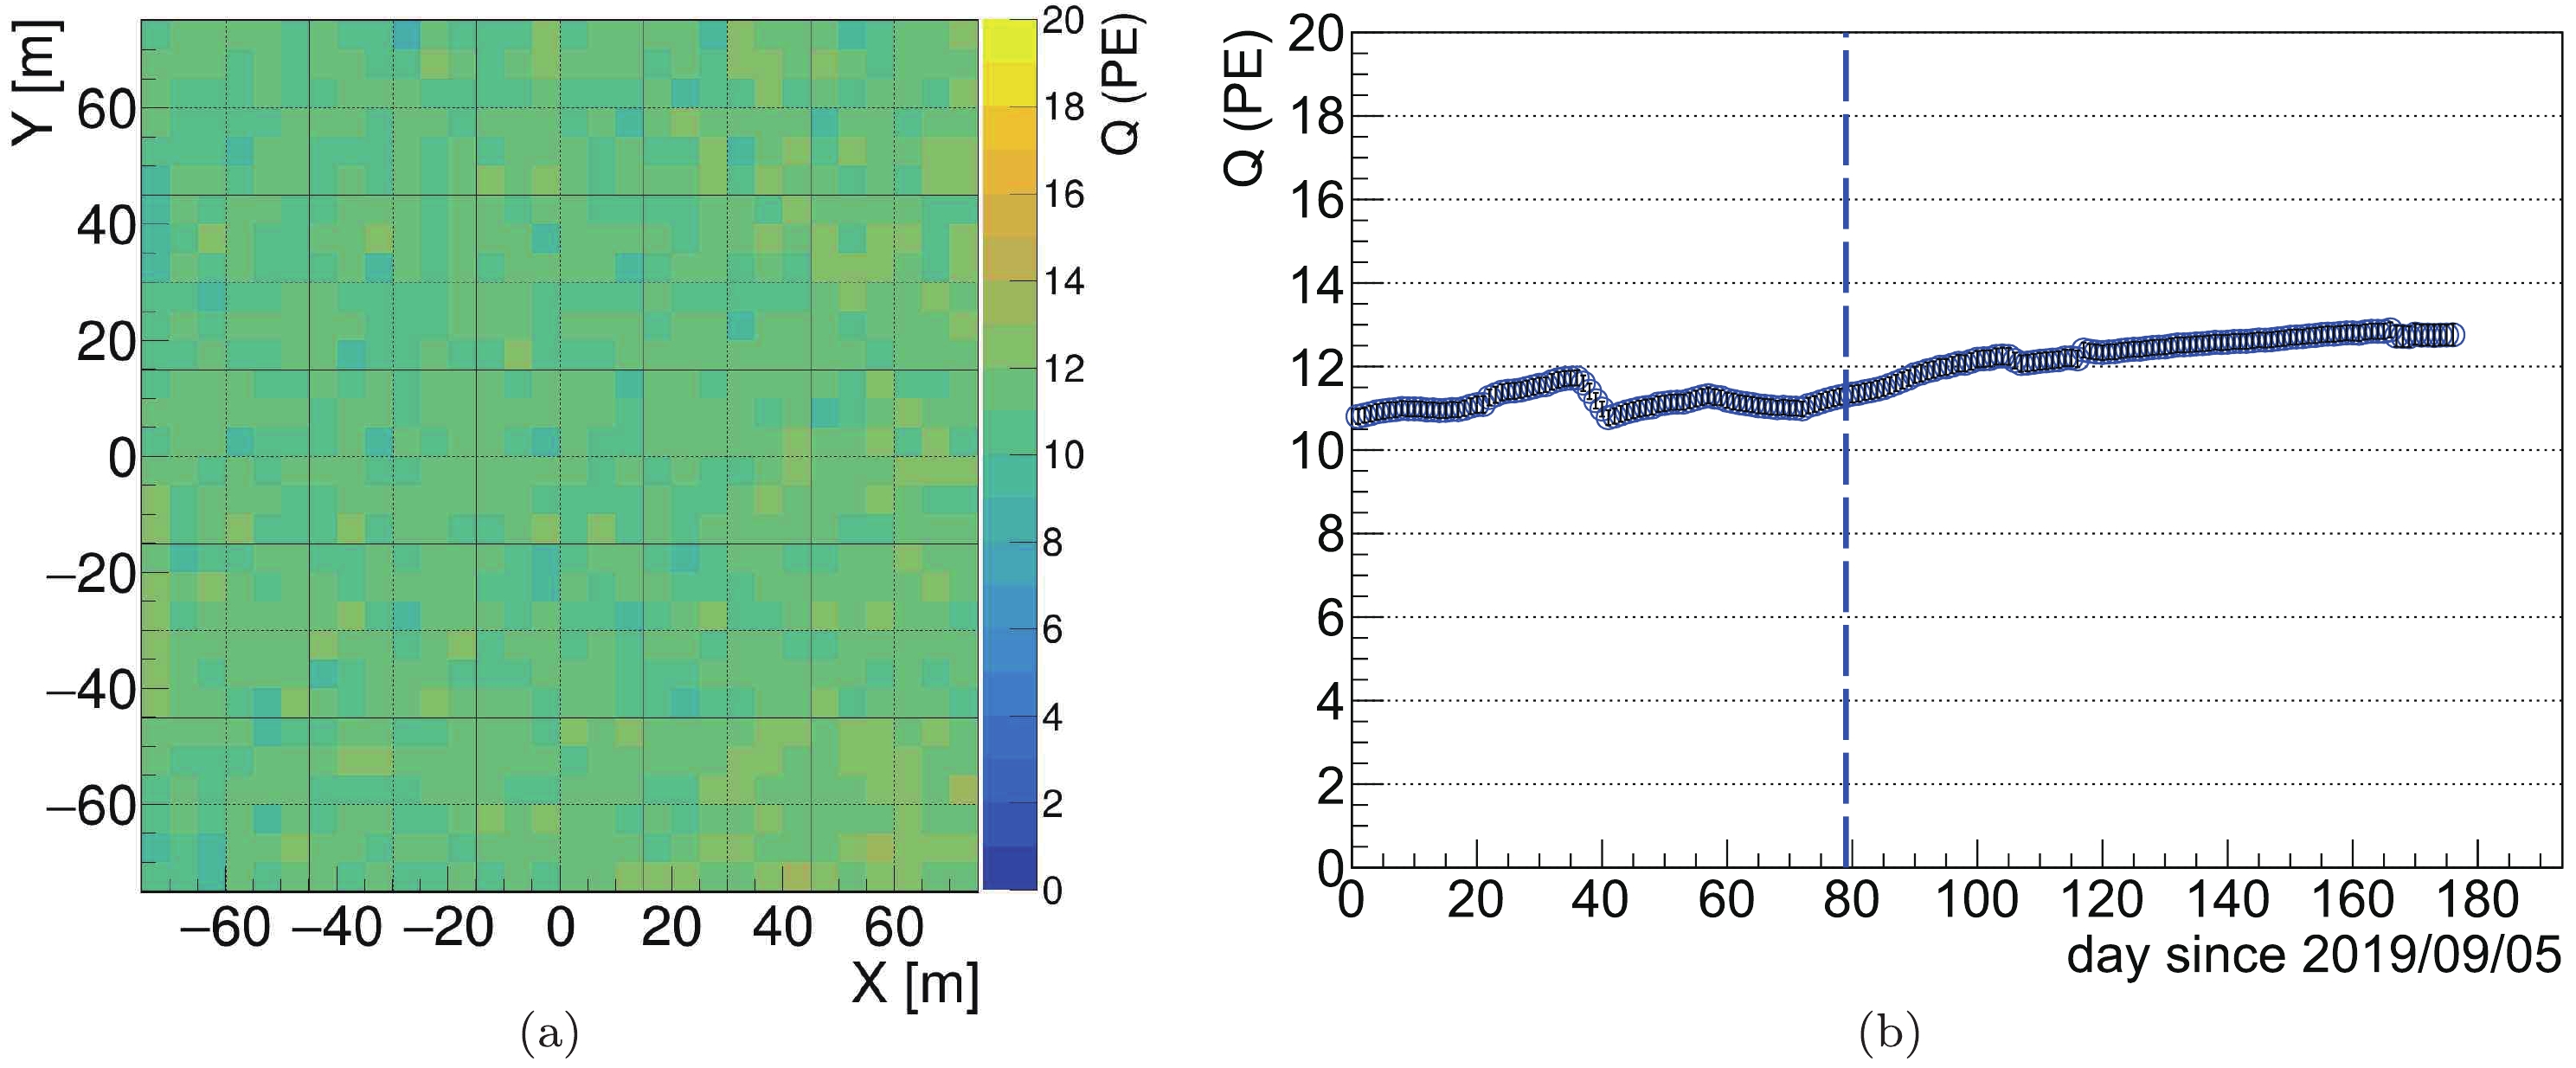
Figure 7. (color online) (a) Map of charges at the “muon peak” measured by all WCDA-1 units on Nov. 22, 2019. The average charge is 11.6 PE, and the spread of charges is 0.6 PE among the 900 units. (b) Variation of the average charge at the muon peak over 179 days, from Sept. 5, 2019 to Feb. 29, 2020. This variation indicates the change in water transmission over this period of time. The dashed vertical line marks the ‘standard’ day, Nov. 22, 2019.
With such a well-calibrated uniform and stable detector, the trigger rates of detector units caused by the high energy cosmic rays, instead of the muons, should be the same among the 900 units and also stable. This has been tested at the threshold
$Q_{\rm th} = 2$ PE. It was found that the spread over 900 units is within 2.3%. The stability of the rate is 1.3% over 170 days since Sept. 1, 2019. This test also shows a spread of 5.9% and stability of 2.9% at$Q_{\rm th} = 0.3$ PE. This will be discussed in the systematic analysis below. -
WCDA-1 began operation on April 26, 2019. In a short test run, a large volume of monitoring data was collected to validate the operation. A trigger algorithm was implemented to record cosmic ray air showers by requiring at least 20 groups, where a group is 3
$ \times $ 3 detector units, with each group being hit simultaneously in a window of 300 ns. A hit is formed if any one of the nine 8" PMTs in the cluster receive a signal greater than the threshold of 1/3 PE. The detector has been fully operational for a stable survey of the northern sky since then. The air shower event rate is approximately 45 kHz, while the trigger rate of a single detector unit is 22.5 kHz on average. Once a trigger is formed, charges recorded by both 8" and 1.5" PMTs in 2$\mu$ s are read out, together with the absolute trigger time, to construct a complete shower event. Further reconstruction of the air shower to determine its geometrical properties is carried out after the event building. In Fig. 8, the daily live time of WCDA-1 is plotted as a function of time since April, 26, 2019, the day WCDA-1 was turned on. A total of$ \thicksim 1.7\times10^{9} $ shower events was recorded and successfully reconstructed every day during the stable operation for 179 days from Sept. 5, 2019 to Feb. 29, 2020. The analysis reported in this paper uses the data acquired in this period of time. Afterward, the operation was switched to combined mode with both WCDA-1 and WCDA-2 participating.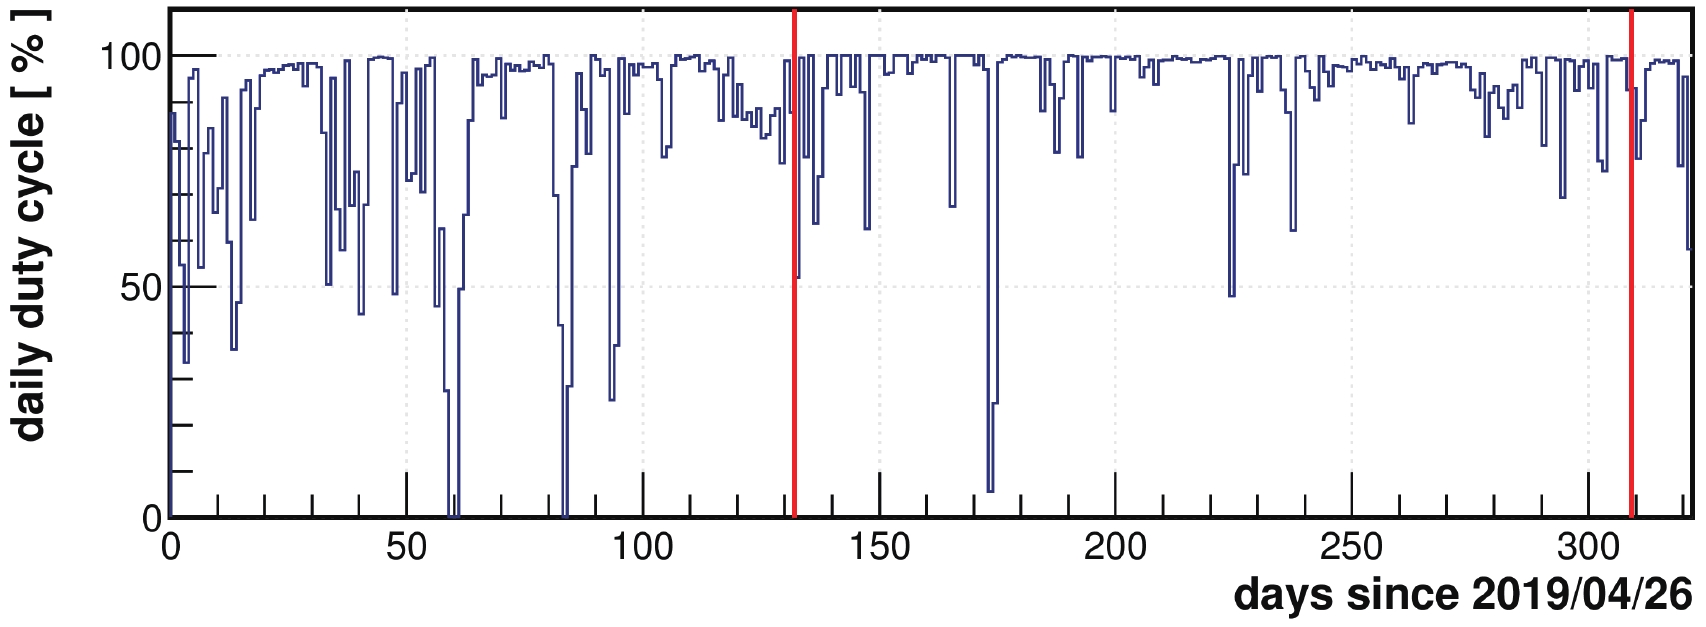
Figure 8. (color online) Daily live time of WCDA-1 as a function of days since April 26, 2019. Two red vertical lines indicate the stable operation period, i.e., from Sept. 5, 2019 to Feb. 29, 2020, the data from which are used for the analysis in this paper. Approximately 1.7
$ \times 10^9 $ shower events were recorded and successfully reconstructed every day during this period of time. -
For an air shower event, the arrival direction and core location are reconstructed in two steps. The first step is to find the arrival direction by assuming a planar shower front using the number of triggered 8-inch PMT units, called
$N_{\rm hit}$ , that are registered in the event, with their locations$ (X_i $ ,$ Y_i) $ and trigger time$ t_i $ . The charge$ Q_i $ is used to weight the i-th unit as defined below. The arrival direction is the normal vector of the plane. Units that have trigger times too far ($ >100 $ ns) from the plane are considered to be random triggers caused by noise and rejected in further steps with the remaining$N_{\rm hit}$ units. The fitting procedure is iterated until$N_{\rm hit}$ becomes constant.The second step is to find the shower core location
$ (X_c, Y_c) $ and refine the arrival direction reconstruction by assuming a conical shower front centered at$ (X_c, Y_c) $ . The core location is found by calculating the charge-weighted averages$ X_c = \Sigma^{N_{10}}_{i = 1} Q_iX_i/\Sigma^{N_{10}}_{i = 1} Q_i $ and$ Y_c = \Sigma^{N_{10}}_{i = 1} Q_iY_i/\Sigma^{N_{10}}_{i = 1} Q_i $ , where$N_{10} = 0.1N_{\rm hit}$ , and i runs over the units that record the highest charges. The conical front is defined by the time offsets$ t(R) = c\cdot R $ with respect to the plane found in the previous step, where R is the distance from the core in the plane and c is the conical coefficient, set to 0.07 ns/m for gamma ray induced showers in the working energy range of WCDA-1. At this point, 8-inch PMTs that have trigger times farther than 30 ns from the conical front are rejected again as noise triggers.$N_{\rm hit}$ is renewed by counting the surviving hits.$N_{\rm hit}$ is selected as a shower energy estimator in the analysis. For showers in the WCDA-1 working energy range, most of the hits have only one or two PEs. This enables a simple shower energy reconstruction based on the nearly linear relationship between$N_{\rm hit}$ and the primary energy. For the pure electromagnetic cascade induced by gamma rays, the Monte-Carlo simulation of the shower development is reliable for establishing the energy response function. The distribution of$N_{\rm hit}$ for the well reconstructed shower events is shown in Fig. 9 as the curve in red. There is a clear pile-up of events with$N_{\rm hit} > 840$ that indicates the saturation of$N_{\rm hit}$ , which has a maximum of 900. This will be discussed in detail in Sec. IV.C.
Figure 9. (color online) Left panel: Distribution of the number of triggered 8-inch PMTs after filtering out random noise hits (in red) and after the
$ C>10 $ gamma selection cut (in black). This cut causes a reduction of 97.2% for events with$N_{\rm hit} <$ 550. Right panel: Distribution of compactness for cosmic-ray and simulated gamma events and the quality factor Q as a function of compactness, for$N_{\rm hit}$ = 100-200. -
To maximize the sensitivity to gamma ray showers, effective cosmic-ray background suppression is essential. For showers induced by cosmic rays, primarily protons, the secondary particles are more spread out laterally than for gamma-ray-induced showers. In either case, secondary particles, primarily gamma rays and electrons, rapidly induce sub-showers in water and lose all their energy over a few tens of centimeters. All relativistic charged particles in the sub-showers generate Cherenkov light in water with an emitting angle of 41.3°. The Cherenkov photons in each detector unit are sampled by the PMTs, thus forming a footprint of the shower in WCDA-1. A typical cosmic ray event with
$N_{\rm hit} = 189$ is shown in the right panel of Fig. 10. Each dot indicates a registered unit, with the size indicating the corresponding measured charge. A clear dense area indicated by the dashed circle marks the core location of the shower; however, many large hits are also found throughout the footprint. Those ‘hot spots’ are mostly due to muons produced in the air shower, which can easily penetrate through the entire depth of WCDA-1, producing Cherenkov light along their entire track, thus yielding stronger signals. Because muons are produced by the decay of$ \pi^{\pm} $ generated in the shower, they carry the transverse momentum of pions, so that they are distributed over a wider area in general, when they arrive at the ground. Therefore, in addition to the smooth lateral distribution yielded by the electromagnetic component, there are isolated ‘hot spots’ outside the core region.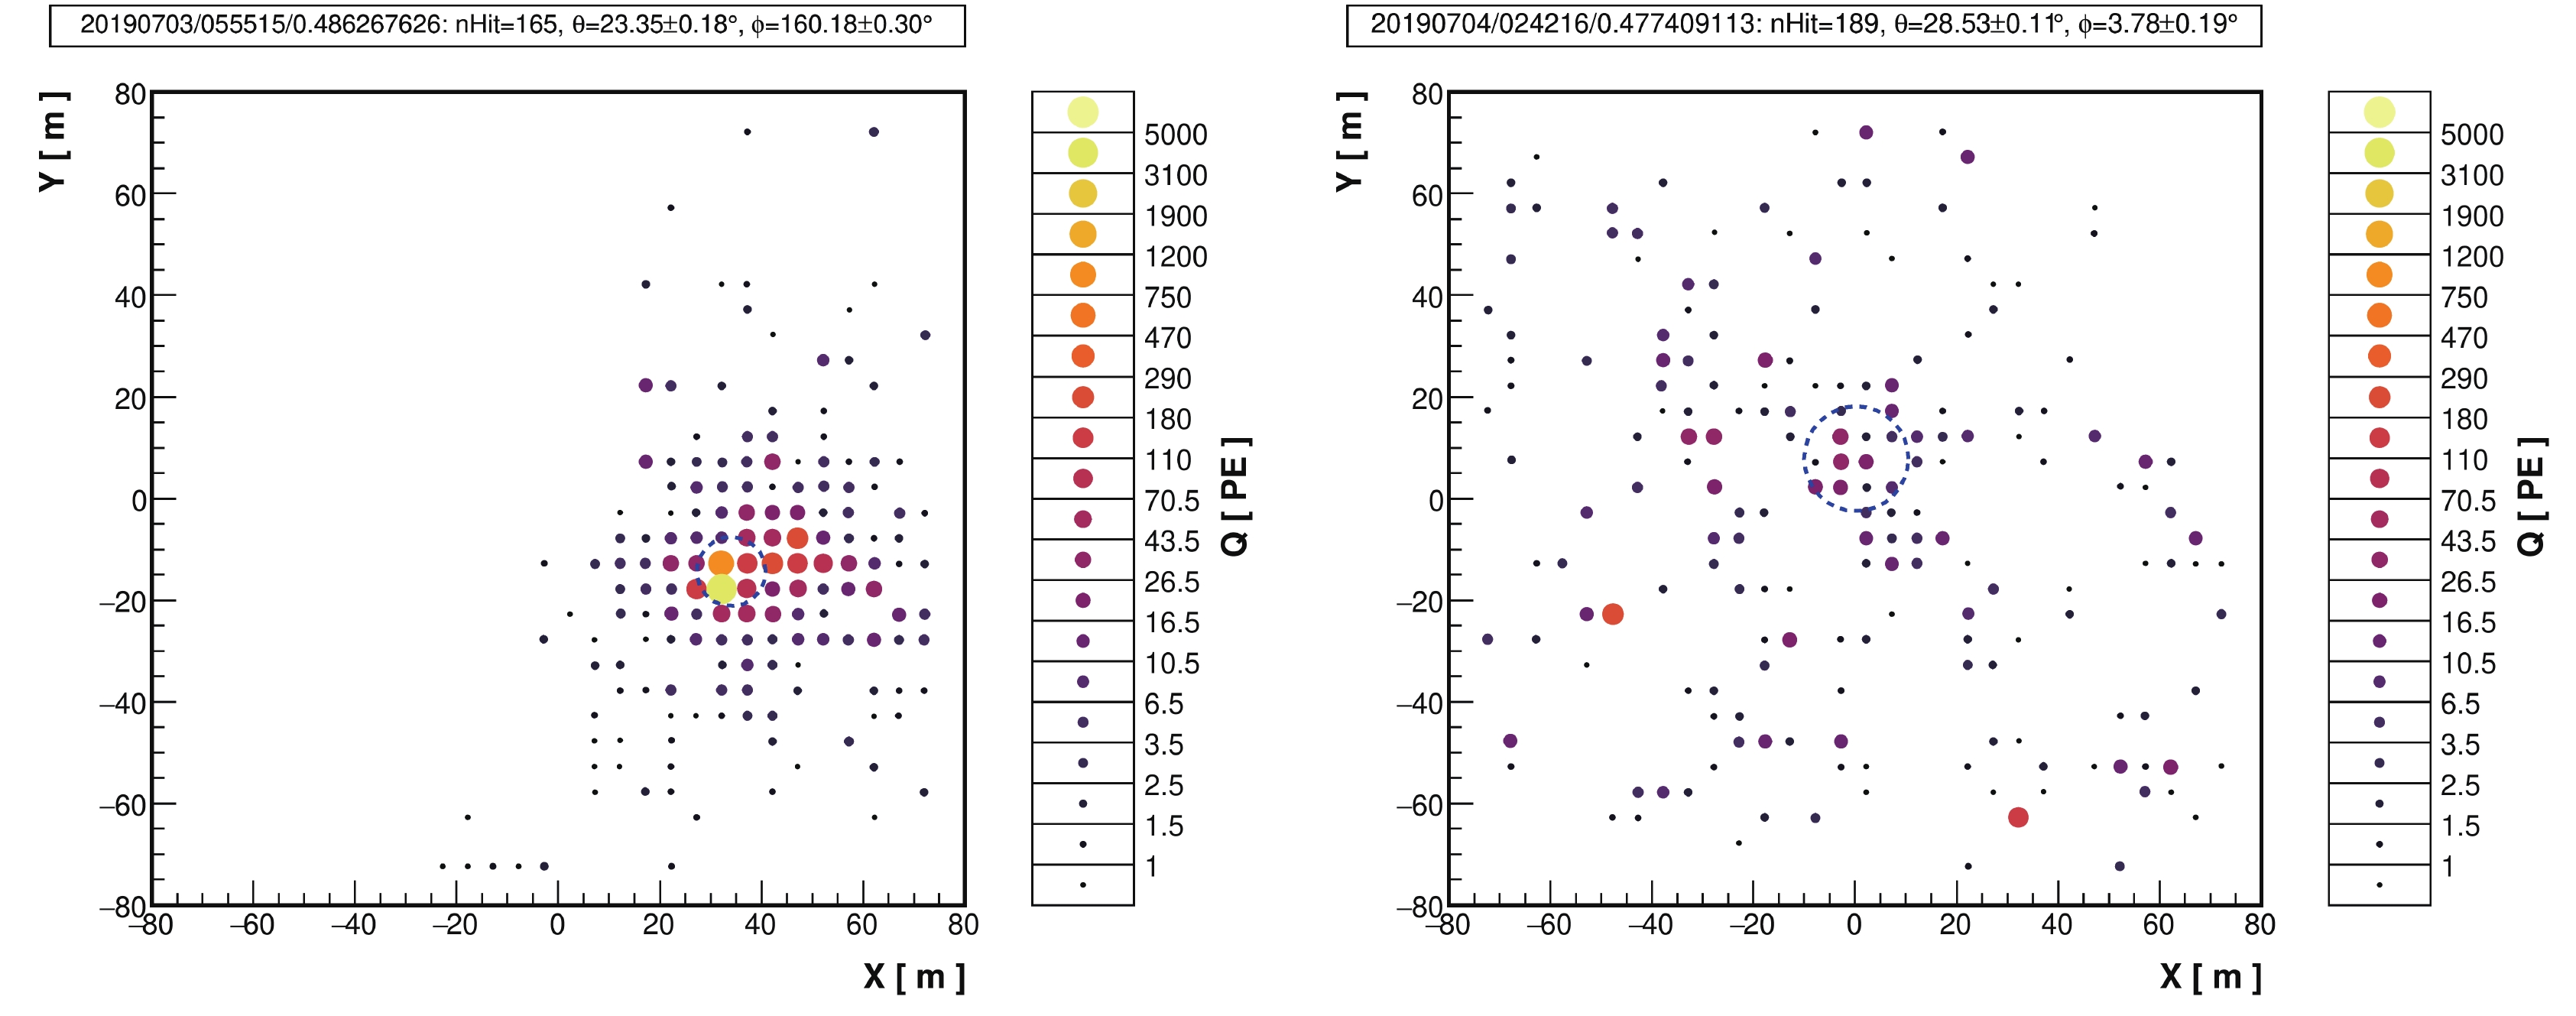
Figure 10. (color online) A high-confidence gamma-ray candidate event from the direction of the Crab Nebula with
$N_{\rm hit}$ = 165 and a compactness value of$ C = 39 $ (left panel), and a similar background cosmic-ray event with$N_{\rm hit}$ = 189 and$ C = 1.0 $ (right panel). Dashed circles indicate the reconstruction uncertainties of the shower cores.In contrast, a typical gamma-ray-induced shower from the direction of the Crab Nebula as shown in the left panel of Fig. 10 has a more compact and rather smooth distribution of charges in the footprint measured by WCDA-1. With a similar
$N_{\rm hit} = 165$ , the event has a better defined single core region because the shower is a pure electromagnetic cascade process. Such a clear difference between the gamma ray signal and the cosmic-ray background allows suppression of the flux of cosmic rays in a specific gamma-ray source region, in particular for a large detector such as WCDA-1 that contains almost all of the secondary particles in showers.To characterize the features of showers induced by different primary particles, a parameter named compactness was invented by the Milagro collaboration [6]. The compactness is defined as
$C = N_{\rm hit}/{\rm Max}(Q_i;r > R_c)$ , where the maximum function finds the brightest unit outside an area of radius$ R_c $ centered at the shower core. The lack of hot spots in the shower, in the case of gamma rays, makes the compactness C obviously larger than that of most background cosmic rays with the same$N_{\rm hit}$ . For WCDA-1, at an altitude of 4410 m, an$ R_c $ of 45 m is found to be optimal because the electromagnetic component of showers becomes sufficiently dim beyond$ R_c $ to make any muon signal outstanding. By cutting for$ C>10 $ , the cosmic-ray background can be significantly reduced. This is shown in Fig. 9. The red data points in the left panel show the$N_{\rm hit}$ distribution for all triggers (after filtering out random noise hits as described above), while the black data points are for triggers with$ C>10 $ , rejecting much of the cosmic-ray background. In the range of$N_{\rm hit} <$ 550, approximately 97.2% of cosmic ray events are rejected. The rejection power gradually improves with the event size and reaches 99.8% for large showers with 700 hits. The right panel of Fig. 9 shows the compactness distributions of cosmic ray (black line) events and simulated gamma events (blue dot line) for$N_{\rm hit}$ in the range of 100-200. Also shown in this figure is the quality factor Q as a function of compactness, where Q =$ \epsilon_{g}/\sqrt\epsilon_{p} $ ; here,$ \epsilon_{g} $ and$ \epsilon_{p} $ are the efficiencies of gamma-ray and cosmic-ray events surviving from the compactness cut. Events from the direction of the Crab Nebula can be used to find a suitable threshold for the parameter C by maximizing the significance of their detection, as described in the following section. -
The Crab Nebula is one of the strongest and most widely studied gamma-ray sources. Its position, angular extension, flux, and spectral energy distribution (SED) have been studied in detail [7]. The coordinates of the Crab Nebula in the equatorial system (RA, dec) are
$ (83.63^\circ, 22.02^\circ) $ . The angular extension is much less than 0.07° in the TeV regime. Events measured by WCDA-1 within an area of 6$ ^{\circ} $ $ \times $ 6$ ^{\circ} $ , centered at the Crab nominal position, have been collected and filled in a grid of$ 0.1^{\circ}\times 0.1^{\circ} $ , after converting the arrival direction of the shower from local coordinates$ (\theta, \phi) $ , zenith and azimuth angles, and trigger time to equatorial coordinates. The background has been suppressed as described above. Here, we tuned the threshold to be$ C>10 $ .To calculate the excess signals from the Crab Nebula direction, the remaining background of the cosmic rays is estimated using two different methods for cross-checking. The first one is the so-called ‘direct integration’ method, developed by the MILAGRO collaboration [6]. This method is based on the assumption that acceptance of the detector, in local coordinates, is independent of the trigger rate over a period of several hours and that the cosmic-ray background is isotropic. The last assumption is well justified by the low-energy range considered in this analysis. The acceptance map is properly normalized and transformed into an efficiency map, which is applied to the events that passed the cuts, as measured at time t.
An alternative method is the so-called ‘equal zenith angle method’, developed by the AS
$ _\gamma $ collaboration [8]. This method also relies on the assumption of isotropy of the cosmic-ray background. For each bin$ (t,\theta,\phi) $ where the source is supposed to be, the background is integrated over all other bins of the same size at nearby azimuthal angles and the same zenith angle as the source bin. In this analysis, the background is integrated over six azimuthal bins around the one with the source. Therefore, the observation time ratio between the source and background is 1/6. The underlying assumption for this method is that the detector has a constant detection efficiency for showers arriving at the same zenith angle. The bin size is defined by the point spread function (PSF) of the detector, which is well described by a 2-dimensional Gaussian functional form with the angular resolution defined as$ \Psi_{68}\sim 1.51\sigma = 0.84^\circ $ , where$ \sigma $ is the standard deviation of the Gaussian function and$ \Psi_{68} $ is the angle of a cone containing 68% probability for the lowest energies in this analysis. The cross check of the background estimation between the two methods showed no noticeable difference. It is necessary for both the event map and background map in the grid to be smoothed using the PSF. The excess map is then obtained by subtracting the background map from the event data map.The significance map around the Crab Nebula and the distribution of the events as a function of the significance are shown in Fig. 11. Here, the background is estimated using the ‘direct integration’ method, and the significance is estimated following the method used in [9]. A clear Crab image with a significance of 77.4
$ \sigma $ has been achieved. To calculate the integrated sensitivity of WCDA-1, all events that have$N_{\rm hit} > 100$ collected up to Feb. 29, 2020 are used, including those before Sept. 5, 2019. An integrated sensitivity of 65 mCU per year above 1 TeV (see below) is confirmed by the observation. The position of the image center at R.A. =$ 83.65^\circ\pm0.04^\circ $ and Dec =$ 22.05^\circ\pm0.04^\circ $ indicates that the pointing accuracy of WCDA-1, as a gamma ray telescope, is better than$ 0.05^\circ $ .
Figure 11. (color online) Two-dimensional significance map around the position of the Crab Nebula (left) and the distribution of the significance among
$3600\times 900$ bins (right). Measured background cosmic ray events are well distributed along a standard normal distribution, and the gamma ray signals are clearly distributed over a wide region from$\sim 4 \sigma$ to 77$\sigma$ .The PSF width of WCDA-1 depends on the shower size, i.e., the shower arrival direction is better measured for larger showers because the shower front is smoother with a larger charge being detected at more sampling points. Therefore, all events collected in the period from Sept. 5, 2019 to Feb. 29, 2020 around the Crab Nebula are grouped into six bins of
$N_{\rm hit}$ , namely [60,100],[100,200], [200,300], [300,400], [400,500], and [500,800]. Figure 12 shows the excesses in the six bins as a function of the space angle between the events and the location of the Crab Nebula. This gives a clear measurement of the PSF in terms of the space angle of the cone in which 68% of events are contained as a function of shower size, namely 0.84°, 0.45°, 0.39°, 0.29°, 0.21°, and 0.20° in the six bins, respectively. Events with$N_{\rm hit} > 800$ give a measure of PSF of 0.20°. Events with$N_{\rm hit} < 60$ are too small to be reconstructed reliably and are not taken into account in the analysis in this paper.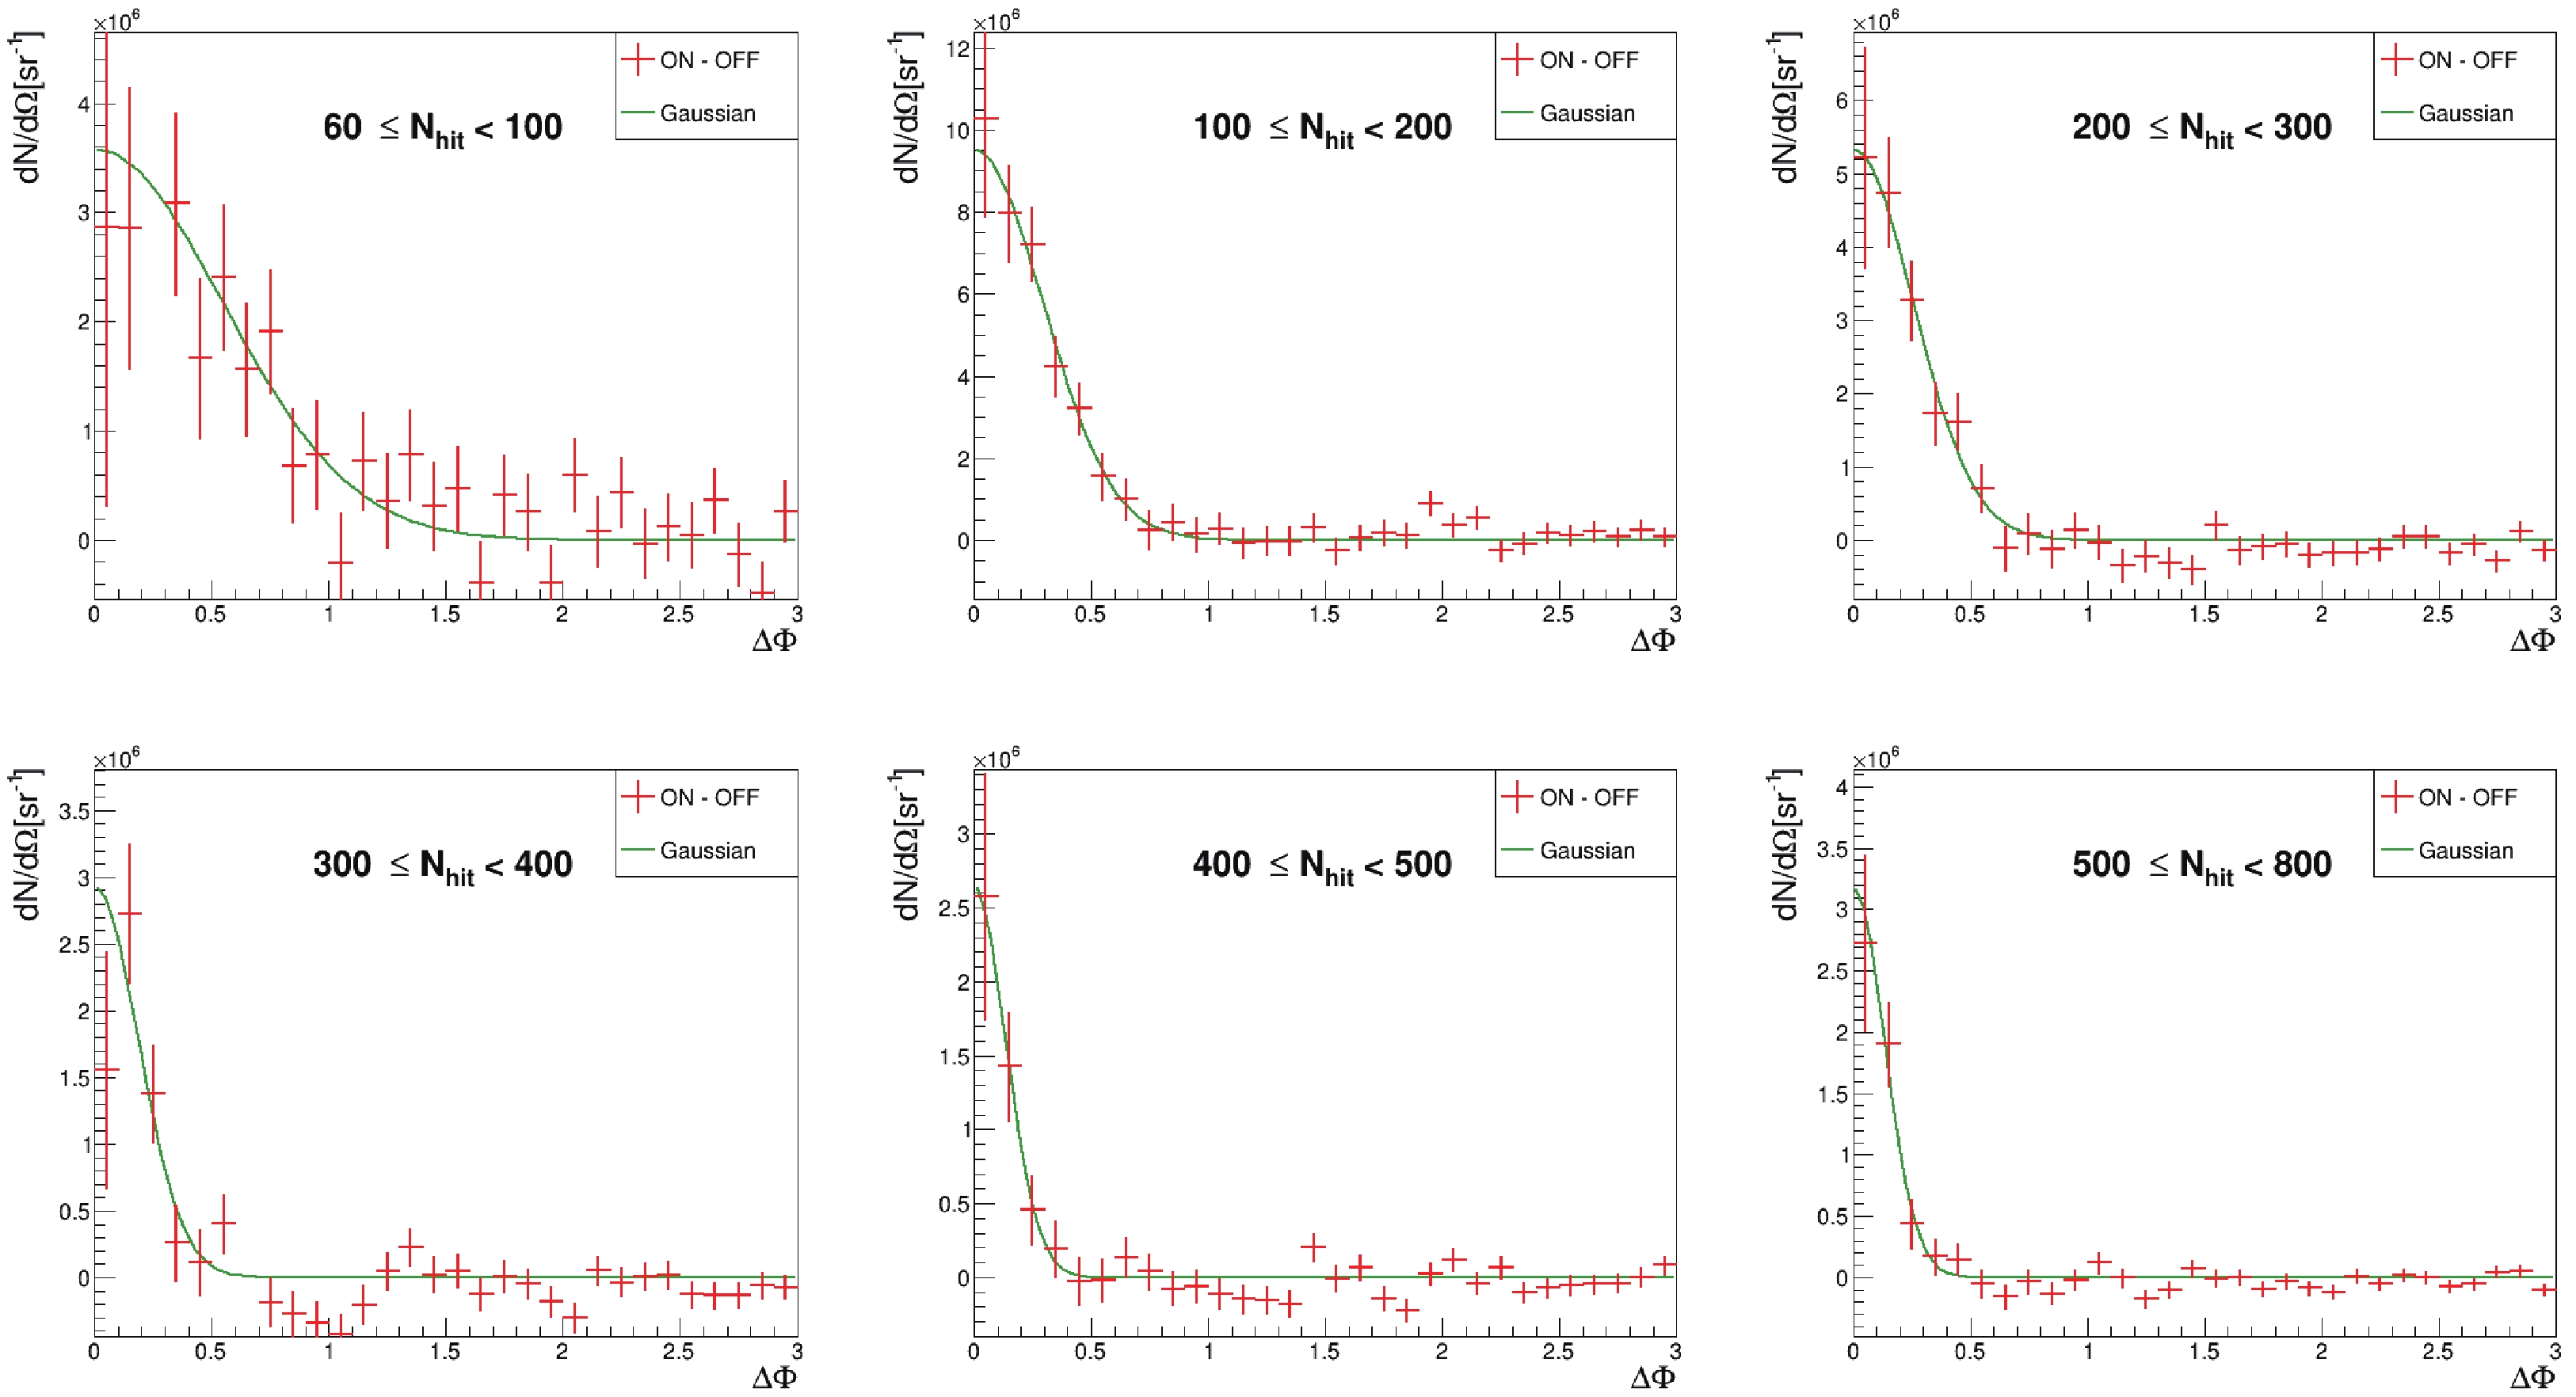
Figure 12. (color online) Distribution of excess events as a function of the space angle with respect to the Crab Nebula direction in the six bins of
$N_{\rm hit}$ . The solid curves indicate 2D-Gaussian fits to the excesses, which result in angular resolutions of 0.84°, 0.45°, 0.39°, 0.29°, 0.21°, and 0.20° in the six bins, respectively. -
The air shower events are generated using CORSIKA v75000 [10]. Hadronic models EPOS-LHC [11] and FLUKA [12] are selected for interactions above and below 100 GeV, respectively. All shower particles have been tracked down to the threshold energy of 50 MeV for hadrons and muons and of 0.3 MeV for pions, photons, and electrons [13]. Five primary cosmic ray mass groups, i.e., H, He, C-N-O, Mg-Al-Si, and Fe, are simulated in the background estimation. The Poly-gonato model [14] is used for the fluxes and spectral indices of the species. The energy range of the incident cosmic rays is assumed to be from 10 GeV to 1 PeV for protons and helium and from 100 GeV to 1 PeV for the remaining three groups. Cosmic rays are assumed to isotropically arrive in the zenith angle range from 0
$ ^{\circ} $ to 60$ ^{\circ} $ . The energy spectrum of gamma rays is sampled from a power law SED with an index of 2.71 for the signals from the Crab Nebula. Every air shower event generated using CORSIKA is initiated at 100 random locations in an area of$2000 \;{\rm{m}} \times 2000\;{\rm{m}}$ centered at the center of WCDA-1 and followed by detailed simulation of the response of WCDA-1. More than 1.5$ \times10^{8} $ comic ray events and 2.7$ \times10^{8} $ gamma ray events have been generated in total. -
The code G4WCDA based on GEANT4 [15] has been developed to simulate the water Cherenkov detector response in the LHAASO experiment. To investigate the detector performance and correctly estimate the acceptance of WCDA-1, the detailed geometry and structure of the pond, including its roof, steel structure, beams, columns, concrete walls, detector suspension structure, and water transparency, are all taken into account in G4WCDA. Because approximately 300 Cherenkov photons are produced by an electron or a muon per centimeter of their tracks in water, most of the CPU time is consumed to simulate the huge number of Cherenkov photons for their propagation, including scattering and absorption in water. To improve the simulation efficiency, the propagation process is completed in two sequential steps, as sketched in Fig. 13. In the first step, photons and secondary particles in sub-showers are traced without taking into account the attenuation resulting from scattering or absorption. For only those that entered into a small volume of
$80\, {\rm cm} \times 80 \, {\rm cm} \times 80 \, {\rm cm}$ around the PMTs in each detector unit are all parameters of the photons and secondary particles collected and stored in a ROOT [16] file. In the second step, the attenuation is taken into account for the stored photons. The surviving photons and the secondary particles and newly generated photons are further traced until they reach the photocathodes of the PMTs. This approach has proven to be very effective in coping with various detector operation conditions, especially those associated with the water transmission, which was changing in the beginning phase of operation of WCDA-1.
Figure 13. (color online) Sketch of the two step simulation procedure in G4WCDA. Left panel: Cherenkov photons/secondary particles were traced in water until entering the box in the vicinity of the PMTs. Right panel: Only photons or secondary particles that survived the attenuation cut were further traced until reaching the photocathodes of the PMTs.
The validity of the simulation was tested by comparing the distributions of several shower parameters with those measured in the observation. In Fig. 14(a) and (b), comparisons of the zenith (
$ \theta $ ) and azimuth ($ \varphi $ ) angular distributions between the simulated and measured showers with$ \theta<50^{\circ} $ are shown. Good agreement is evident, indicating that the attenuation of showers in the atmosphere as well as the uniform response of the detector array are well described. In addition to the variables related to the arrival direction, two shower energy-related variables are also compared, as shown in panels (c) and (d) of Fig. 14, i.e., the total charge Q and$N_{\rm hit}$ recorded by PMTs, respectively.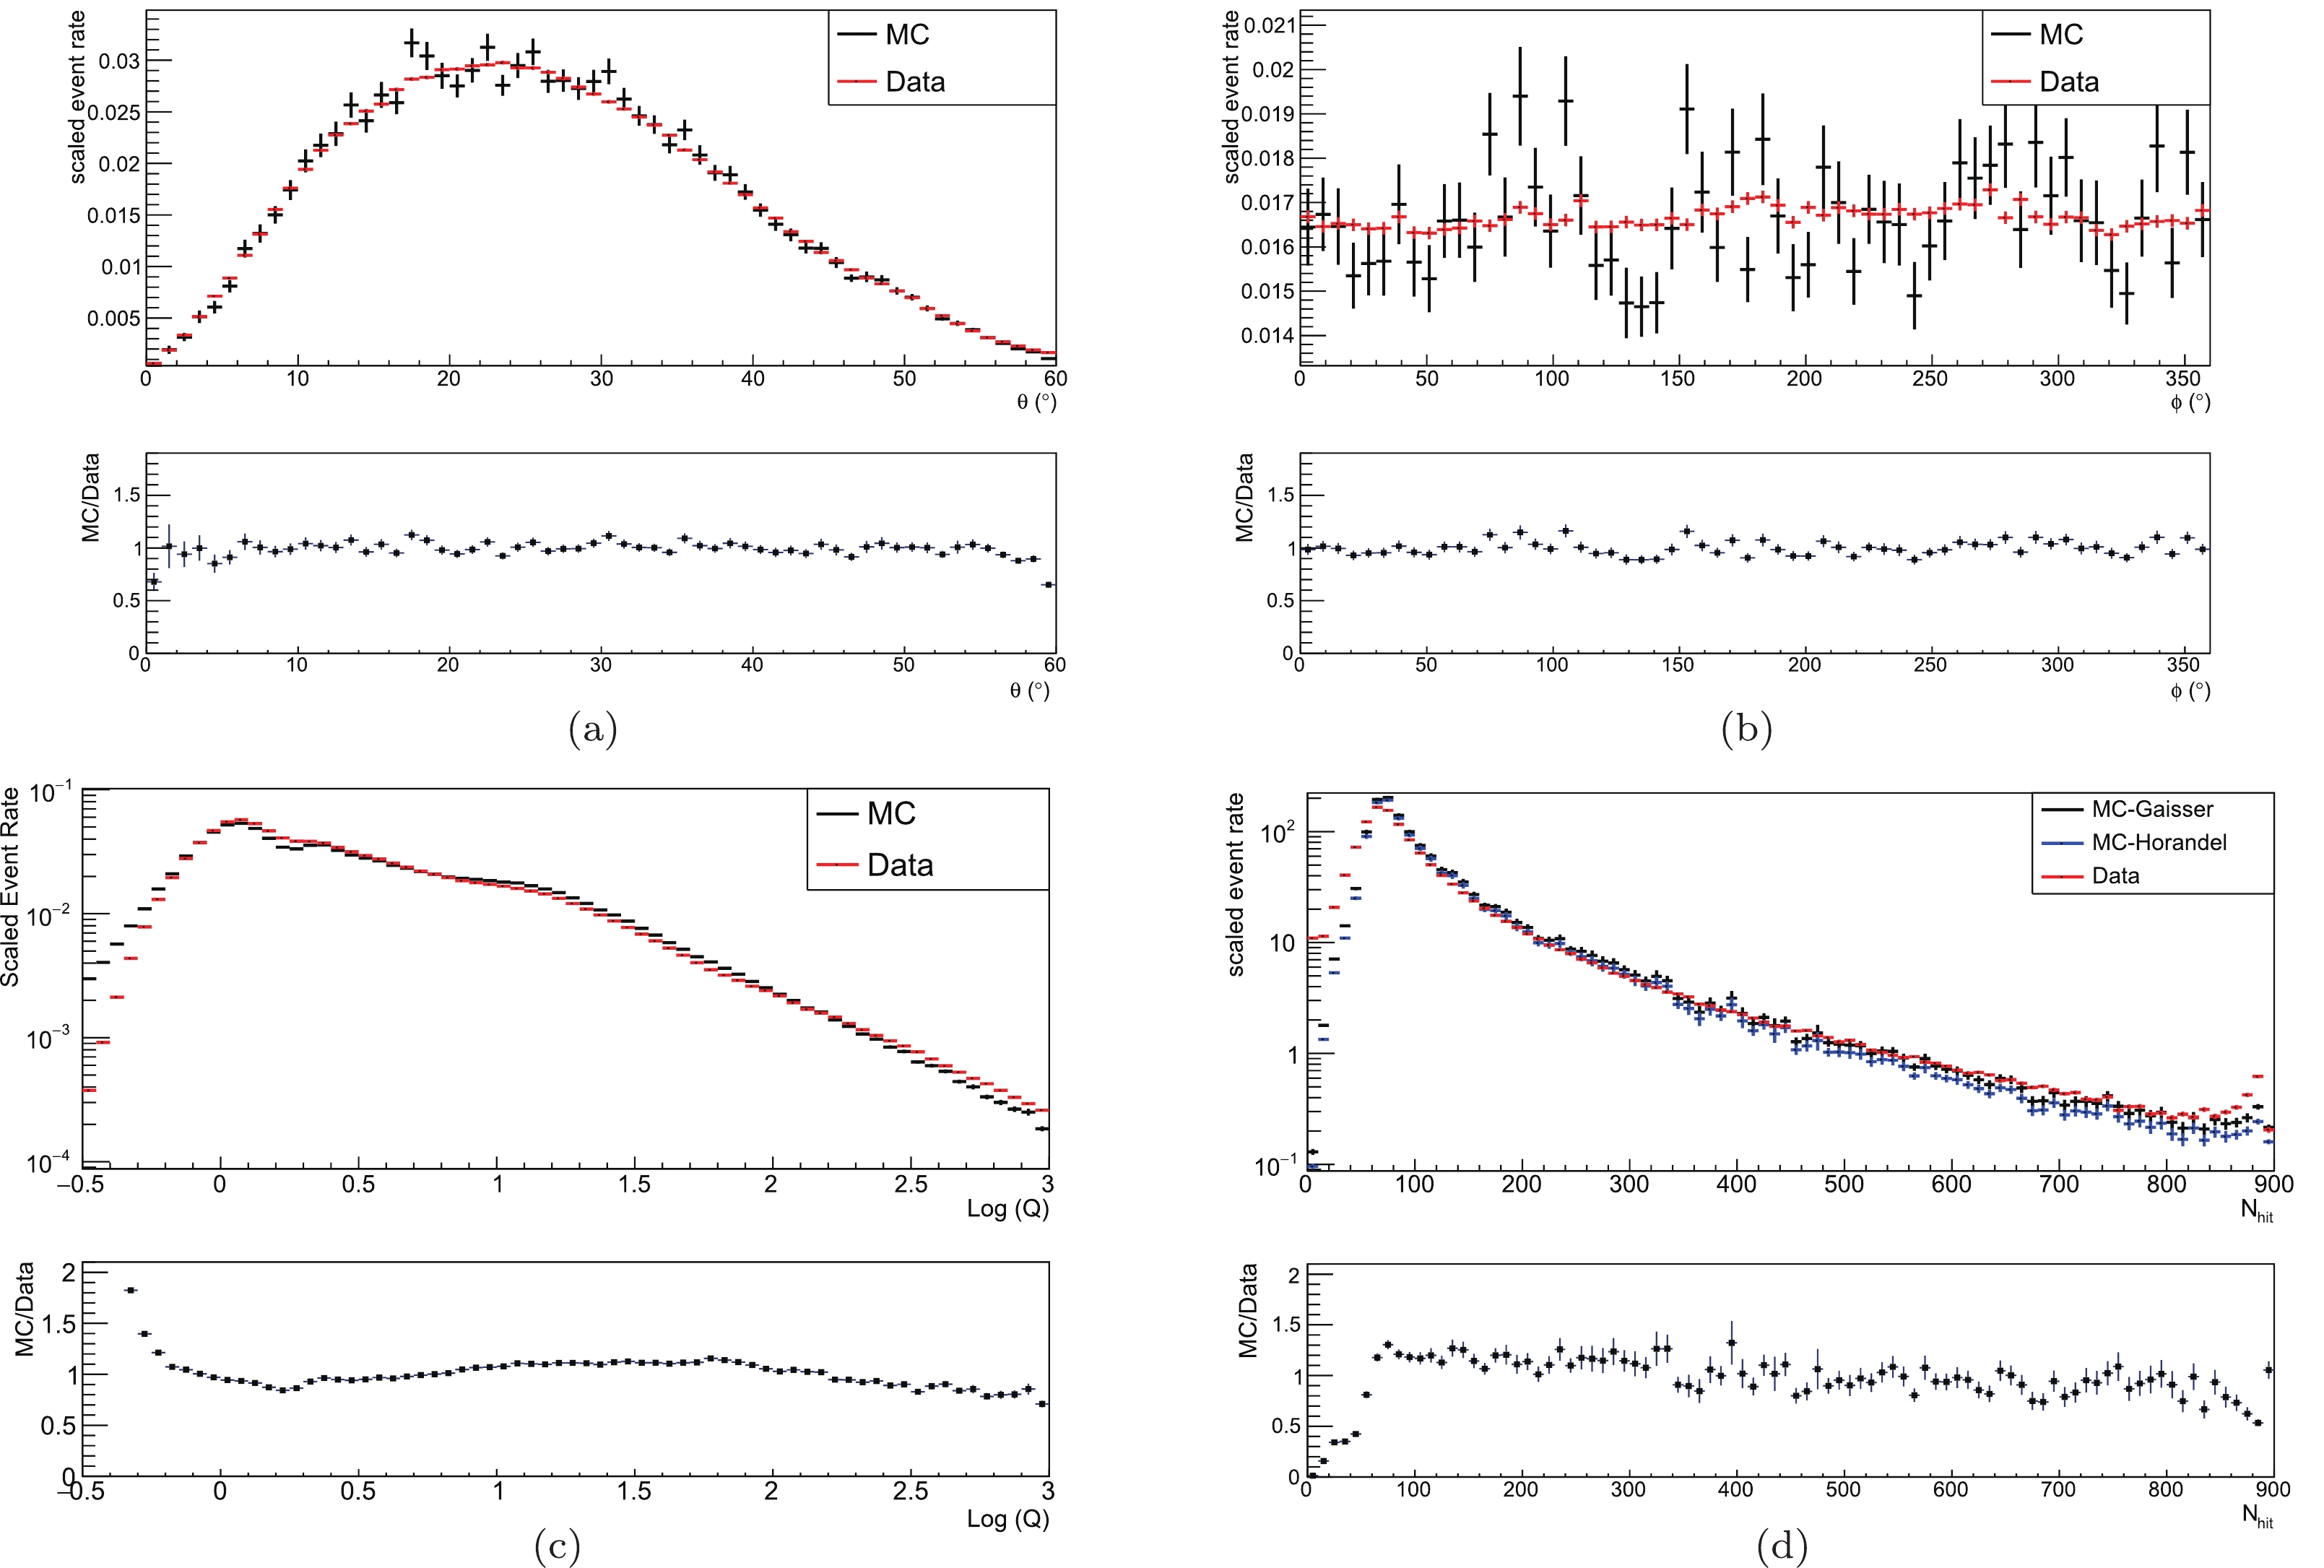
Figure 14. (color online) Comparison between simulated (MC) and measured distributions: (a) distribution of zenith angle, (b) distribution of azimuth angle, (c) distribution of total charge in PE, and (d) distribution of number of hits
$N_{\rm hit}$ in the shower front. The vertical axes are event rates in arbitrary units. In d), simulation results using composition models proposed by Horandel [14] in blue and Gaisser et al. [17] in black are compared with the data.The shower core reconstruction described in Sec. III.A has been verified using the simulated events. The resolution is found to be 15 m, i.e., a circle with a radius of 15 m contains 68% of the content of the distribution of distances between the thrown and reconstructed core locations, for showers having more than 60 hits in the shower front.
To estimate the acceptance of WCDA-1 for gamma ray showers, the ratio of gamma ray showers surviving the C-cut for cosmic-ray background suppression has to be estimated correctly. The measured and simulated C distributions are compared in the left panel of Fig. 15. The agreement between the data and the simulation indicates that the algorithm is valid for the gamma-ray-induced showers from the direction of the Crab Nebula. In the right panel, the C distribution of selected events is compared with that for simulated showers with an assumption of a simple power law gamma ray spectrum of
$ E^{-2.71} $ . With a cut, e.g.,$ C>10 $ , a certain number of gamma ray showers are cut, while some cosmic-ray background events still survive after balancing between a signal-to noise ratio and sufficient gamma-like data statistics for later energy spectrum measurement. Simultaneously, the efficiency of gamma ray detection, or in other words the effective area, is also estimated in each bin of$ N_{\rm hit} $ , as listed in Table 1.
Figure 15. (color online) Left panel: Distributions of compactness for data (in black) and simulated cosmic-ray background events (in red). Right panel: Distributions of compactness for selected gamma-like events and simulated events assuming a simple power-law gamma-ray spectrum
$ \propto E^{-2.71} $ .${ N}_{\rm hit}$ 

$E_{\rm med}$ 

$/{\rm TeV}$ 

Excess Background Significance (σ) Differential Flux/(cm−2 s−1 TeV−1) (a) 60 - 100 0.58 1438.2 24885.8 9.1 $(1.66\pm 0.20 ) \times 10^{-10}$ 

(b) 100 - 200 1.1 1082.7 5202.3 15.0 $(2.89\pm 0.23 ) \times 10^{-11}$ 

(c) 200 - 300 2.4 456.2 1376.8 12.3 $(4.74\pm 0.48 ) \times 10^{-12}$ 

(d) 300 - 400 3.9 161.2 335.8 8.8 $(1.12\pm 0.17 ) \times 10^{-12}$ 

(e) 400 - 500 5.9 60.3 77.7 6.8 $(3.54\pm 0.74 ) \times 10^{-13}$ 

(f) 500 - 800 12.1 82.7 45.3 12.3 $(6.91\pm 1.0 ) \times 10^{-14}$ 

Table 1. Summary of data used in the measurement of SED of the Crab Nebula over
$ 3.57\times10^{6} $ s. -
As mentioned above, the number of hits found within 30 ns of the reconstructed shower front,
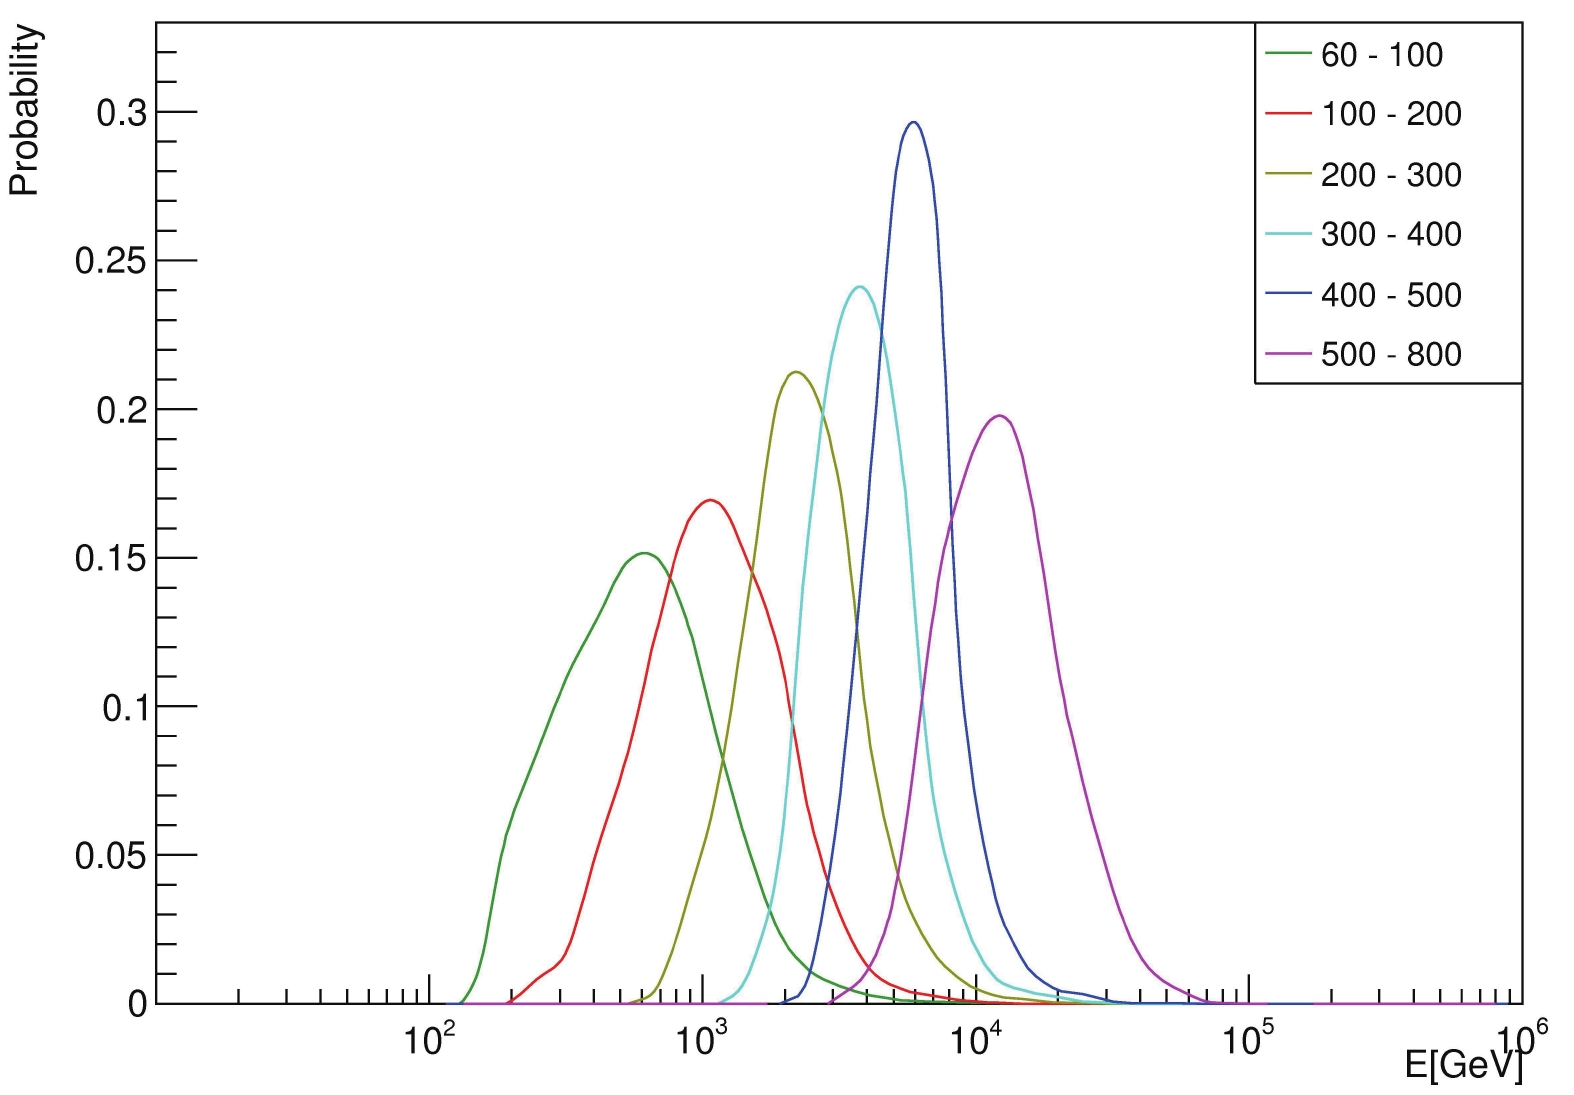
$N_{\rm hit}$ , is selected as the shower energy estimator. For gamma-induced pure electro-magnetic showers, the simulated showers are used to establish the correlation between the primary energy and$N_{\rm hit}$ . In Fig. 16, primary energy distributions for gamma ray showers in the six bins of$N_{\rm hit}$ are plotted. Broad and quite overlapping distributions are observed. This indicates that the energy resolution of the detection with WCDA-1 is not perfect, in particular for showers whose major part may not be contained in WCDA-1. With WCDA-2 and WCDA-3 merged in, the detector sensitive area will be large enough to allow more strict event filtering, and the resolution could be improved for low energy showers in particular. The energy resolution improvement at low energy primarily comes from the reduction of edge effects. Here, the medians of the distributions are used as the measure of the gamma ray energy for showers in the corresponding bins of$N_{\rm hit}$ , as listed in Table 1. The energy resolution could be defined well as a symmetric Gaussian function above 6 TeV, where the resolution is approximately 33%. For lower energies, the resolution of${\rm log}_{10}E$ is better defined by a Gaussian distribution, e.g., with a width of 0.5 decades around 1 TeV. For showers having more than 800 detector units registered, the pile-up effect as shown in Fig. 9 makes the differential flux measurement impossible because of the natural saturation of$N_{\rm hit}$ at 900. An integrated flux above the energy corresponding to$N_{\rm hit} = 800$ could in principle be reported; however, the statistical significance is too weak,$ <2\sigma $ , to be reliable for the flux measurement here. Moreover, including a large number of units with too much charge recorded would require more careful tuning in the simulation to better simulate the response of the detector, as indicated in Fig. 14(d). The high energy events include both gamma-ray and cosmic ray induced showers, thus requiring a better energy estimator than$N_{\rm hit}$ . -
The SED of the Crab Nebula is measured using data collected from Sep. 5, 2019 to Feb. 29, 2020, for a live time of
$ 3.57\times10^{6} $ s. The criteria for events to be used in the analysis are as follows.● the core is within a square of 80 m
$ \times $ 80 m centered at the WCDA-1 center.●
$60 \leqslant N_{\rm hit} < 800$ .● The Crab Nebula was at least 45° above the horizon.
● The compactness is larger than 10.
All of these criteria helped to maximize the detection significance. The corresponding significance, number of events exceeding the background, and remaining cosmic rays in each bin are listed in Table 1. Under the cuts, WCDA-1 has an effective area that varies from approximately 400
${\rm m}^2$ at 600 GeV to a constant of 3200${\rm m}^2$ above 4.5 TeV, as plotted in Fig. 17. Importantly, this indicates that above 4.5 TeV, the SED measurement has a constant efficiency of approximately 50%, primarily becuase of the gamma selection requiring$ C>10 $ .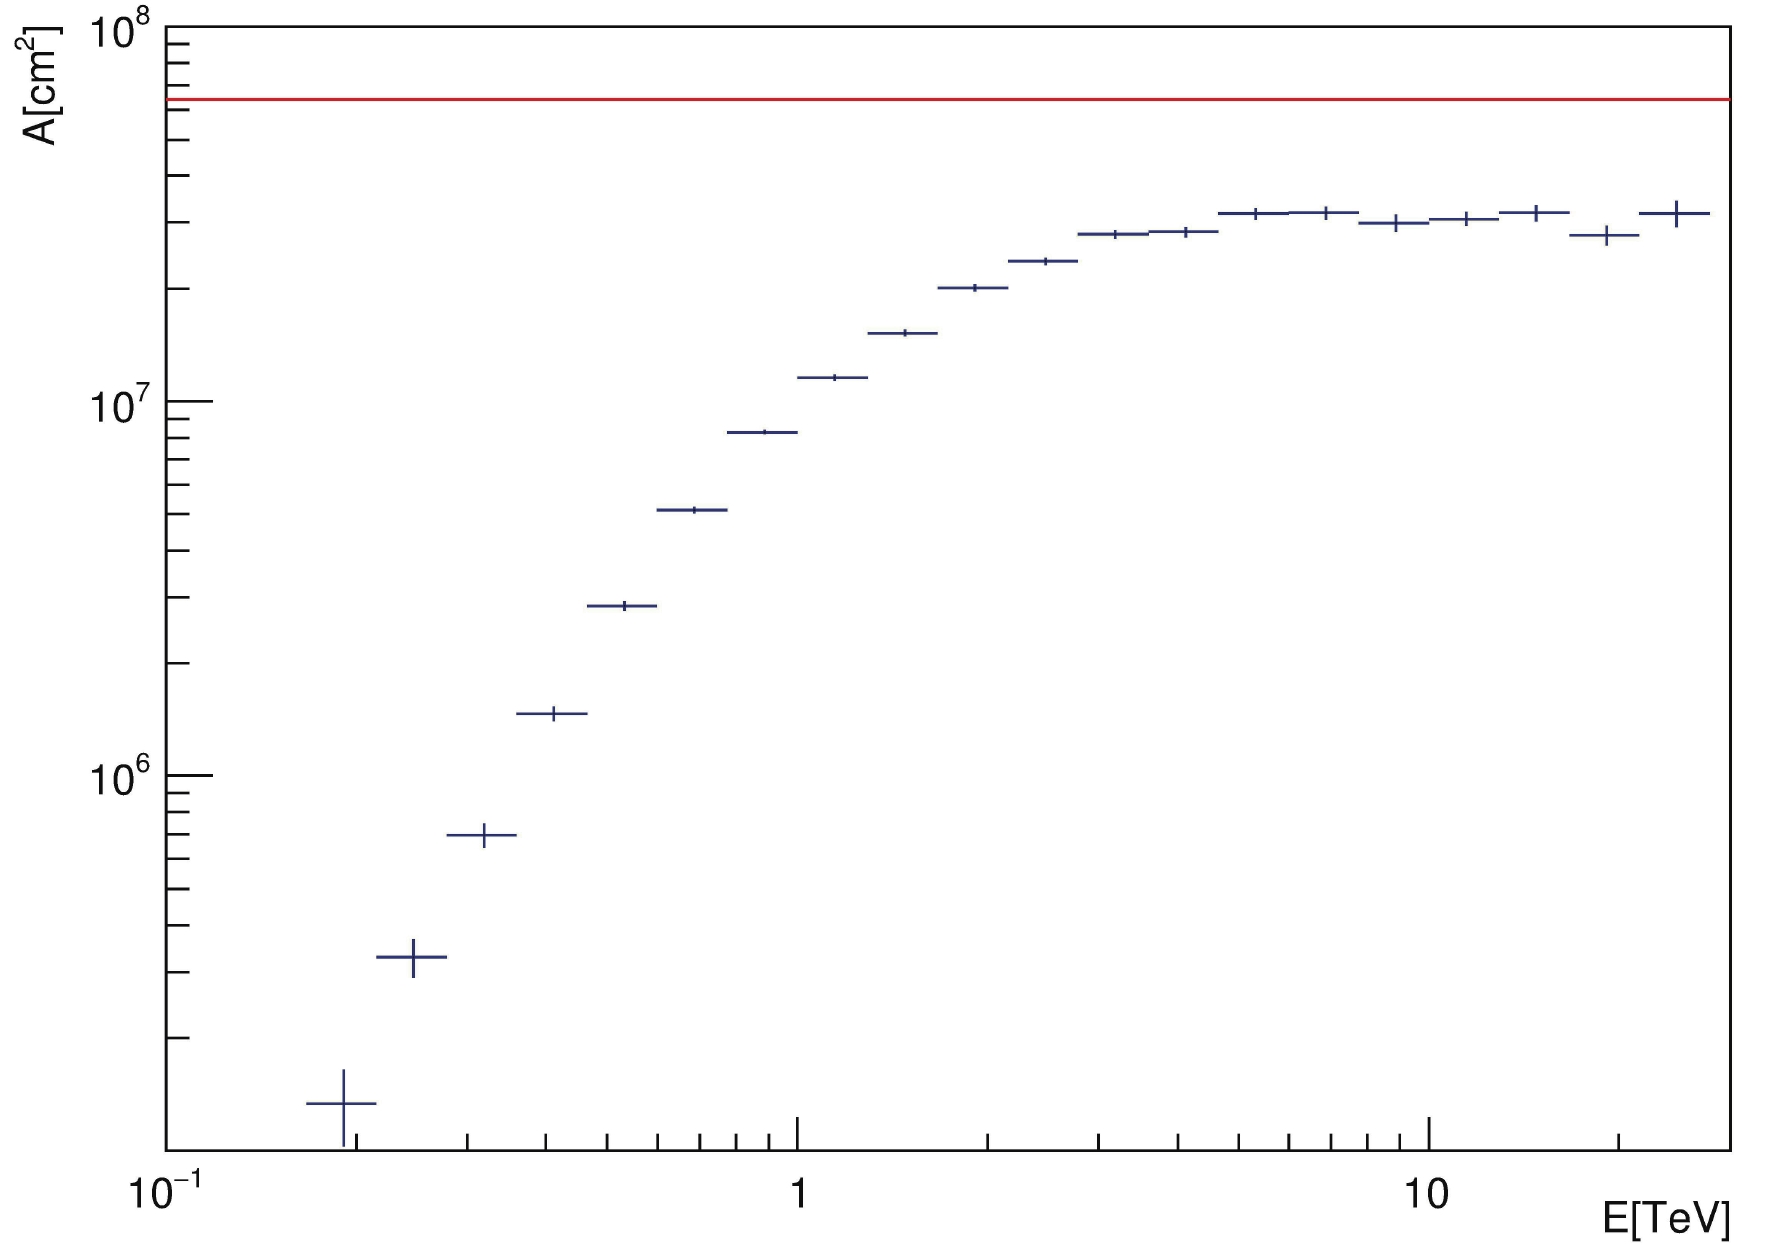
Figure 17. (color online) Effective area of WCDA-1 for Crab detection with the cuts applied in the analysis according to the simulation for gamma rays. The red line indicates the physical area of the WCDA-1 used in the analysis.
The SED is determined by minimizing the
$ \chi^2 $ function$ \chi^{2} = \sum\limits_{i = 1}^6\frac{\left[N_{i}^{\rm obs} - N_{i}^{\rm exp}(\phi_{0},\alpha,\beta)\right]^2}{(\sigma_{i}^{\rm obs})^2} , $

(1) where
$N_{i}^{\rm obs}$ is the number of events exceeding the background in the i-th bin of$N_{\rm hit}$ ,$\sigma_{i}^{\rm obs}$ is the statistical error of$N_{i}^{\rm obs}$ , and$N_{i}^{\rm exp}(\phi_{0},\alpha, \beta)$ is the expected number of events according to the hypothesis of a log-parabolic model$ \phi(E) = \phi_{0}\left(\frac{E}{\;{\rm{TeV}}}\right)^{-\alpha-\beta\; \ln \left(\frac{E}{\;{\rm{TeV}}}\right)} $

(2) with three parameters (
$ \phi_{0} $ ,$ \alpha $ ,$ \beta $ ), where E is the shower energy,$ \phi $ is the photon flux from the Crab Nebula, and 3 TeV is taken as a reference point because WCDA-1 is the most sensitive at 3 TeV. This formula was suggested as one of the best functional approximations for the Crab nebula spectrum over a wide energy range [18]. The number of events for signals from the Crab Nebula direction is shown in Fig. 12 for each bin of$N_{\rm hit}$ with the background cosmic ray events subtracted. They can be fit quite well with a 2-dimensional Gaussian functional template.The SED measured using WCDA-1 is shown in Fig. 18 as the red points. The energy of each point is the gamma-ray median energy for the corresponding
$N_{\rm hit}$ interval. The corresponding differential flux in each bin is listed also in Table 1. The spectral parameters obtained in the log-parabolic fitting are$ \phi_{0} = (2.32\pm0.19)\times 10^{-12}{\rm{cm}}^{-2}\; $ $ {\rm{ TeV}}^{-1}\;{\rm s}^{-1} $ ,$ \alpha = 2.57\pm0.06 $ , and$ \beta = 0.02\pm0.05 $ with$ \chi^{2}/ndf $ = 0.513, respectively.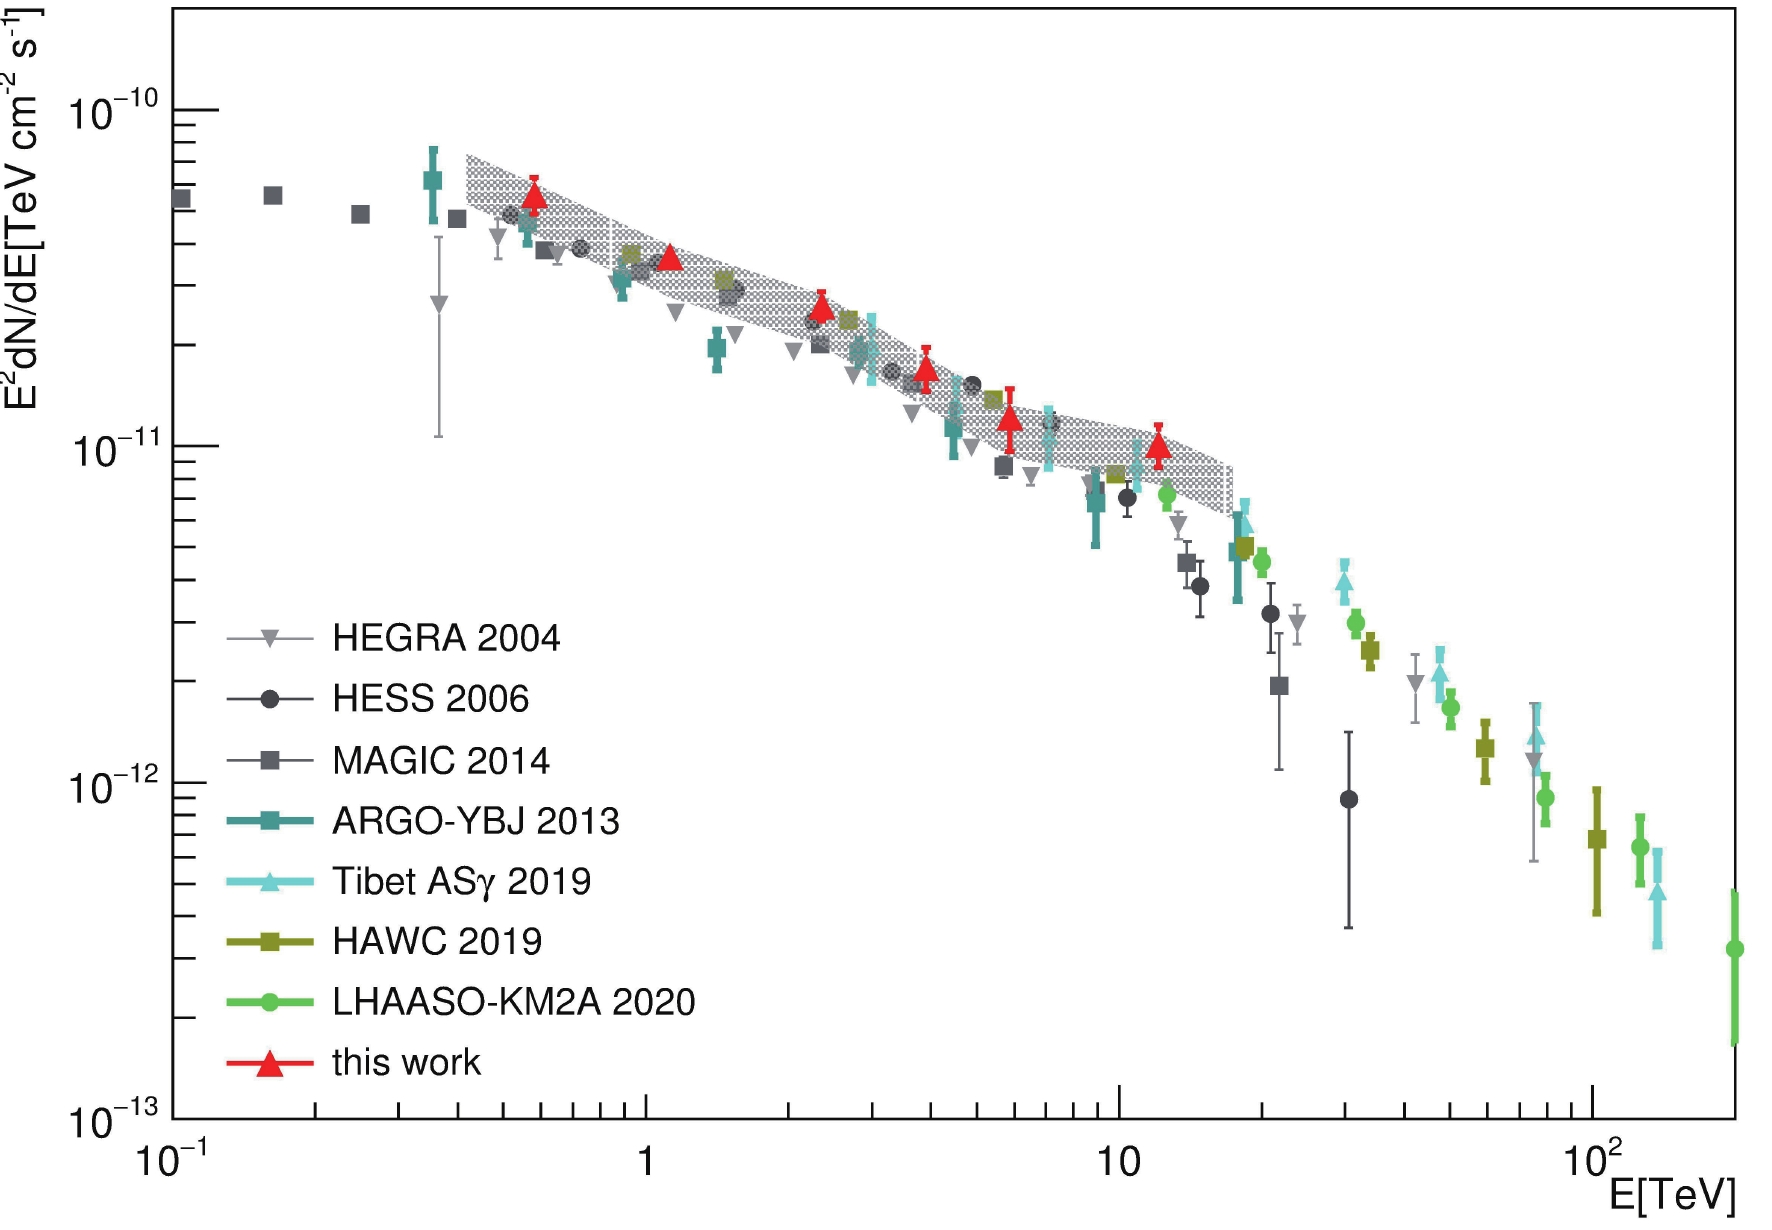
Figure 18. (color online) The SED of the Crab Nebula in the energy range from 800 GeV to 13 TeV measured by WCDA-1 of the LHAASO is shown as the red filled triangles. As a comparison, the SED measured using KM2A of the LHAASO [19] above 10 TeV is shown as the green filled circles. The error bars are statistical errors, and the shaded area represents systematic error. Measurements of other experiments [20-24] are also plotted for comparison.
For comparison, the SED measured by other ground-based gamma ray experiments, i.e., HAWC [20], Tibet AS
$ _\gamma $ [21], and ARGO-YBJ [22], are shown in the same figure, together with the measurements by the IACT experiments, HESS [23], and MAGIC [24].The systematic errors are primarily caused by the following issues. First, WCDA-1 has been continuously improving in terms of the water transparency and detector stability throughout the observation period reported in this paper. This is reflected by Fig. 7(b), which shows that the measured average PMT charge generated by single muons nearly monotonically increased with time, except during major maintenance in October 2019. This requires a correction of approximately
$ \pm $ 11% to the charge measurements, thus introducing an uncertainty in the detection efficiency for events with a small number of hits, i.e., approximately 8.8% at$ Q = 0.3 $ PE, including non-uniformity among 900 detector units and variation over 170 operational days, tested using cosmic rays, which are uniformly distributed and hitting the detector from all directions. Second, the shower and detector simulation is an essential tool in estimation of the detector acceptance in terms of effective area for gamma ray detection. There is no way to check its validity directly using gamma rays because we do not have a known gamma ray beam for testing. However, it can be checked using cosmic rays. Assuming that the central region of WCDA-1, e.g., a circle with a radius of 30 m, is fully efficient for sufficiently large showers, e.g., showers with more than 500 hits, one can calibrate the absolute flux of cosmic rays calculated using the simulation codes in comparison with observations. Here, the details concerning the cosmic ray composition and the models of interactions with the atmospheric nuclei in the relevant energy range below 100 TeV have to be assumed as well. As shown in Fig. 14, there are discrepancies between the simulated and measured distributions. Here, two composition assumptions are compared with data in the$N_{\rm hit}$ distributions. This results in an uncertainty of the estimate of detector efficiency associated with the assumptions, including the entangled issues of interaction modeling and cosmic ray composition. The larger discrepancy of 16% between the two assumptions is taken as a conservative estimate of the corresponding uncertainty of the detector efficiency. The uncertainty of gamma ray detection acceptance estimated using the simulation tool is assumed to be the same in this analysis. Third, the gamma ray shower energy scale is also totally reliant on the simulation. As shown in Fig. 14(c), the simulation of the detector response near the threshold is slightly overestimated. To estimate the associated uncertainty of the energy scale, energies of the gamma events from the Crab Nebula direction have been reconstructed with thresholds of$Q_{\rm th}$ , 0.3 PE, and 0.6 PE. A difference of 3% is found between the average energies resulting from the two reconstructions; thus, a uncertainty of 8% is expected in the SED. The overall systematic uncertainty could be as large as$ ^{+8}_{-24} $ %. It is presented in Fig. 18 as the shaded area around the SED measured by WCDA-1. -
The performance of the first LHAASO water Cherenkov detector, WCDA-1 was tested by observing the Crab Nebula as a standard candle of TeV gamma ray astronomy. The Crab Nebula has been detected with a significance of 77.4
$ \sigma $ , corresponding to a sensitivity of 65 mCU, in agreement with the design specification. The angular resolution for the gamma ray arrival direction was found to be better than 0.4° above 3 TeV, and the pointing accuracy was better than 0.05°. This is the result of a well-measured detector orientation and timing calibration for every detector unit. Air shower and detector simulations are well tuned to reproduce the measured cosmic ray data and used for the gamma-ray shower energy reconstruction and detector acceptance estimation. The spectral energy distribution of the Crab Nebula has been measured in the TeV range from 0.5 TeV to 15.8 TeV, showing good agreement with all other major gamma ray astronomy experiments. -
The authors would like to thank all staff members who work at the LHAASO site, which is situated more than 4400 meters above sea level, year round to maintain the detector and keep the water recycling system, electricity power supply, and other components of the experiment operating smoothly. We are grateful to the Chengdu Management Committee of Tianfu New Area for the constant financial support for research with LHAASO data.
Performance of LHAASO-WCDA and observation of the Crab Nebula as a standard candle
- Received Date: 2021-01-08
- Available Online: 2021-08-15
Abstract: The first Water Cherenkov detector of the LHAASO experiment (WCDA-1) has been operating since April 2019. The data for the first year have been analyzed to test its performance by observing the Crab Nebula as a standard candle. The WCDA-1 achieves a sensitivity of 65 mCU per year, with a statistical threshold of 5


 Abstract
 HTML
HTML Reference
 Related
 PDF
PDF






 DownLoad: