


 Abstract
 HTML
HTML Reference
 Related
 PDF
PDF


-
Similar to rotational bands observed in molecules, many nuclei have an energy spectrum with a pronounced rotational character, and the study of nuclear rotation has been at the forefront of nuclear structure for several decades. In particular, magnetic rotation (MR) [1], which is an exotic rotational phenomenon observed in weakly deformed or near-spherical nuclei and differs from conventional collective rotation in well-deformed nuclei, has been of great interest since the observation of cascades of magnetic dipole (
M1 ) transitions in the region of neutron-deficient Pb isotopes in the 1990s [2–4].The explanation of MR was given in terms of the shears mechanism [5]. In this interpretation, the magnetic dipole vector in the magnetic rotational bands arising from proton particles (holes) and neutron holes (particles) in high-j orbitals rotates around the total angular-momentum vector. Meanwhile, with increasing spin, the proton particles (holes) and neutron holes (particles) in the high-j orbitals align along the total angular momentum, which reduces the perpendicular component of the magnetic dipole moment. Consequently, a typical property of these bands is the decreasing of the
B(M1) values with increasing spin. Experimental indicators for magnetic rotational bands can be summarized as follows [6–10]: 1) aΔI=1 sequence of strong magnetic dipole (M1 ) transitions, corresponding to a reduced transition probabilityB(M1)∼ a fewμ2N , which decrease with increasing spin; 2) weak or absent quadrupole transitions, corresponding to a deformation parameter|β|≲0.15 , which combined with strongM1 transitions results in largeB(M1)/B(E2) ratios,≳20μ2N/(eb)2 ; 3) a smooth variation in theγ -transition energy with angular momentum; 4) a substantial moment of inertia, corresponding to the large ratio of theJ(2)/B(E2)≳100MeV−1(eb)−2 , compared with the values in well-deformed [∼10MeV−1(eb)−2 ] or superdeformed [∼5MeV−1(eb)−2 ] rotational bands.The first clear evidence of magnetic rotational bands was provided by the lifetime measurements for four
M1 -bands in198,199Pb [11]. Afterwards, an increasing number of magnetic rotational bands were observed not only in the mass region ofA∼190 , but also in theA∼60 , 80, 110, and 130 regions. To date, more than 200 magnetic dipole bands spread over 110 nuclides have been observed, which are summarized in the nuclear chart in Fig. 1 based on the review on the observed MR bands [12] and recent observations [13–50]. The blue squares in Fig. 1 represent nuclides with good candidate MR bands, in whichM1 andE2 transition properties are strictly consistent with the features of MR, i.e., decreasingB(M1) values with increasing spin andB(M1)/B(E2)≳20μ2N/(eb)2 , including 50 bands spread over 39 nuclides. The red squares represent other MR candidate nuclides without lifetime measurements.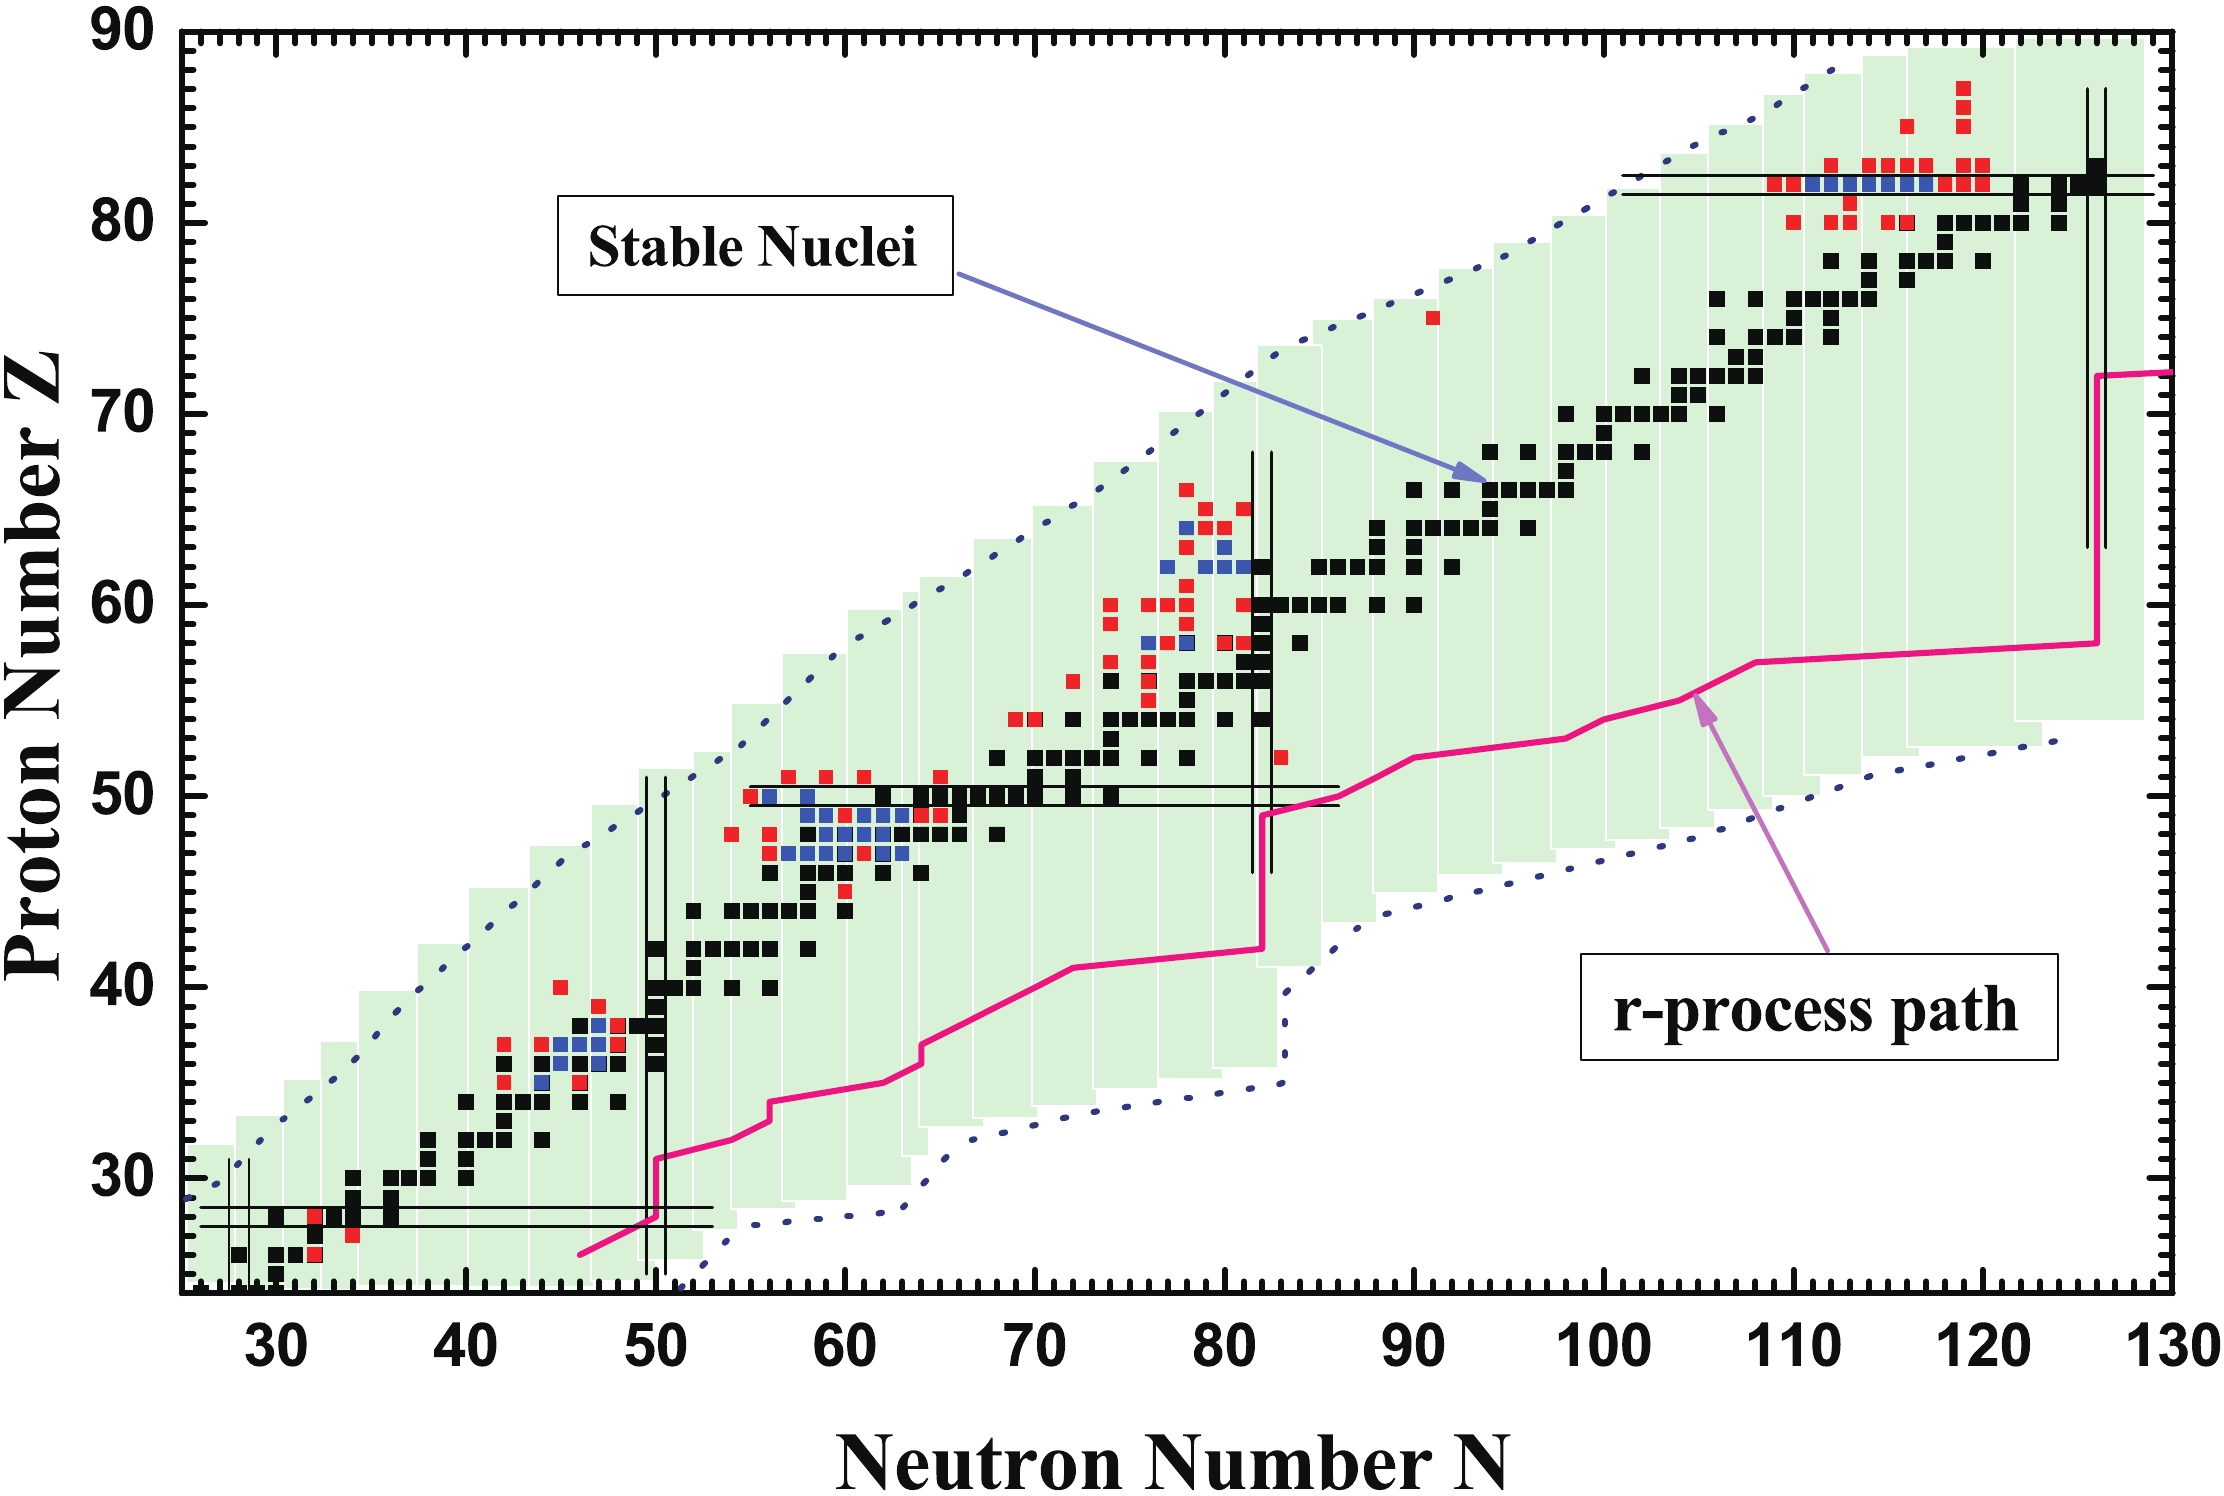
Figure 1. (color online) Candidate nuclides with magnetic rotation observed in the nuclear chart. Blue squares represent nuclides with good candidate MR bands, in which M1 and E2 transition properties are strictly consistent with the features of magnetic rotation. Red squares represent other candidates. The corresponding data are taken from Refs. [12–50].
Signature is the quantum number specifically appearing in a deformed intrinsic system and associated with symmetry under a rotation of
180∘ about the axis of nuclear rotation. A rotational band with aΔI=1 sequence could be divided into two branches classified by the signature quantum number [51–53]. Experimentally, energy staggering between alternate spin states, which is best visualized by the experimental quantityS(I)=[E(I)− E(I−1)]/2I , could be observed in many rotational bands and is usually referred to as signature splitting. Theoretically, no signature splitting should be observed in ideal magnetic rotational bands due to the pure individual motion of nucleons (shears mechanism), and the tilted angle generally remains far from90∘ in the tilted rotational mode of nuclei [5, 7]. However, it is noted that the experimental energy staggering could be found for some MR candidates, as mentioned in Ref. [54].In magnetic rotational bands, their energy spectra show rotational-like features with strong
M1 transitions, and it is noted in Ref. [6] that the rotational-like energy spectra (away from band crossings) approximately follow the pattern ofE(I)−E0∝(I−I0)2 , such as in Pb isotopes [2–4], whereE(I)−E0 is the relative energy of a state with spin I at energyE(I) to the energy of the bandhead state,E0 . The rotational-like behavior observed could be explained by a semiclassical analysis of the shears mechanism from a residual proton-neutron interaction [55]. Therefore, in the MR bands,S(I)∝1−(2I0+1)/2I are supposed to increase with increasing spin, and signature splitting, i.e., energy staggering, is not expected. In comparison, for conventional rotation in well-deformed nuclei, their energy spectra follow the patternE(I)−E0∝I(I+1) [51] based on the simple assumption of a constant moment of inertia, whileS(I) values are constant at various spins.Thus, it is interesting to systematically study energy staggering
S(I) of magnetic rotational bands, especially the ones with suitable electromagnetic transition properties. The present work investigates systematic behaviors ofS(I) in good candidates of MR bands. Furthermore, taking the dipole bands with same configuration in103Rh ,105Ag , and107In as examples, the characteristics ofS(I) in different rotational modes would be compared. -
In Fig. 2, the experimental energy staggering
S(I) for the good candidate MR bands in the mass A~80, 110, 130, and 190 regions are shown, which include 50 bands spread out in 39 nuclides marked with blue squares in Fig. 1. In the 110, 130, and 190 mass regions, the MR bands in even-even, odd-odd ,and odd-A nuclei are presented. The corresponding data are taken from the previous review [12] and recent observations [15–29, 56–58].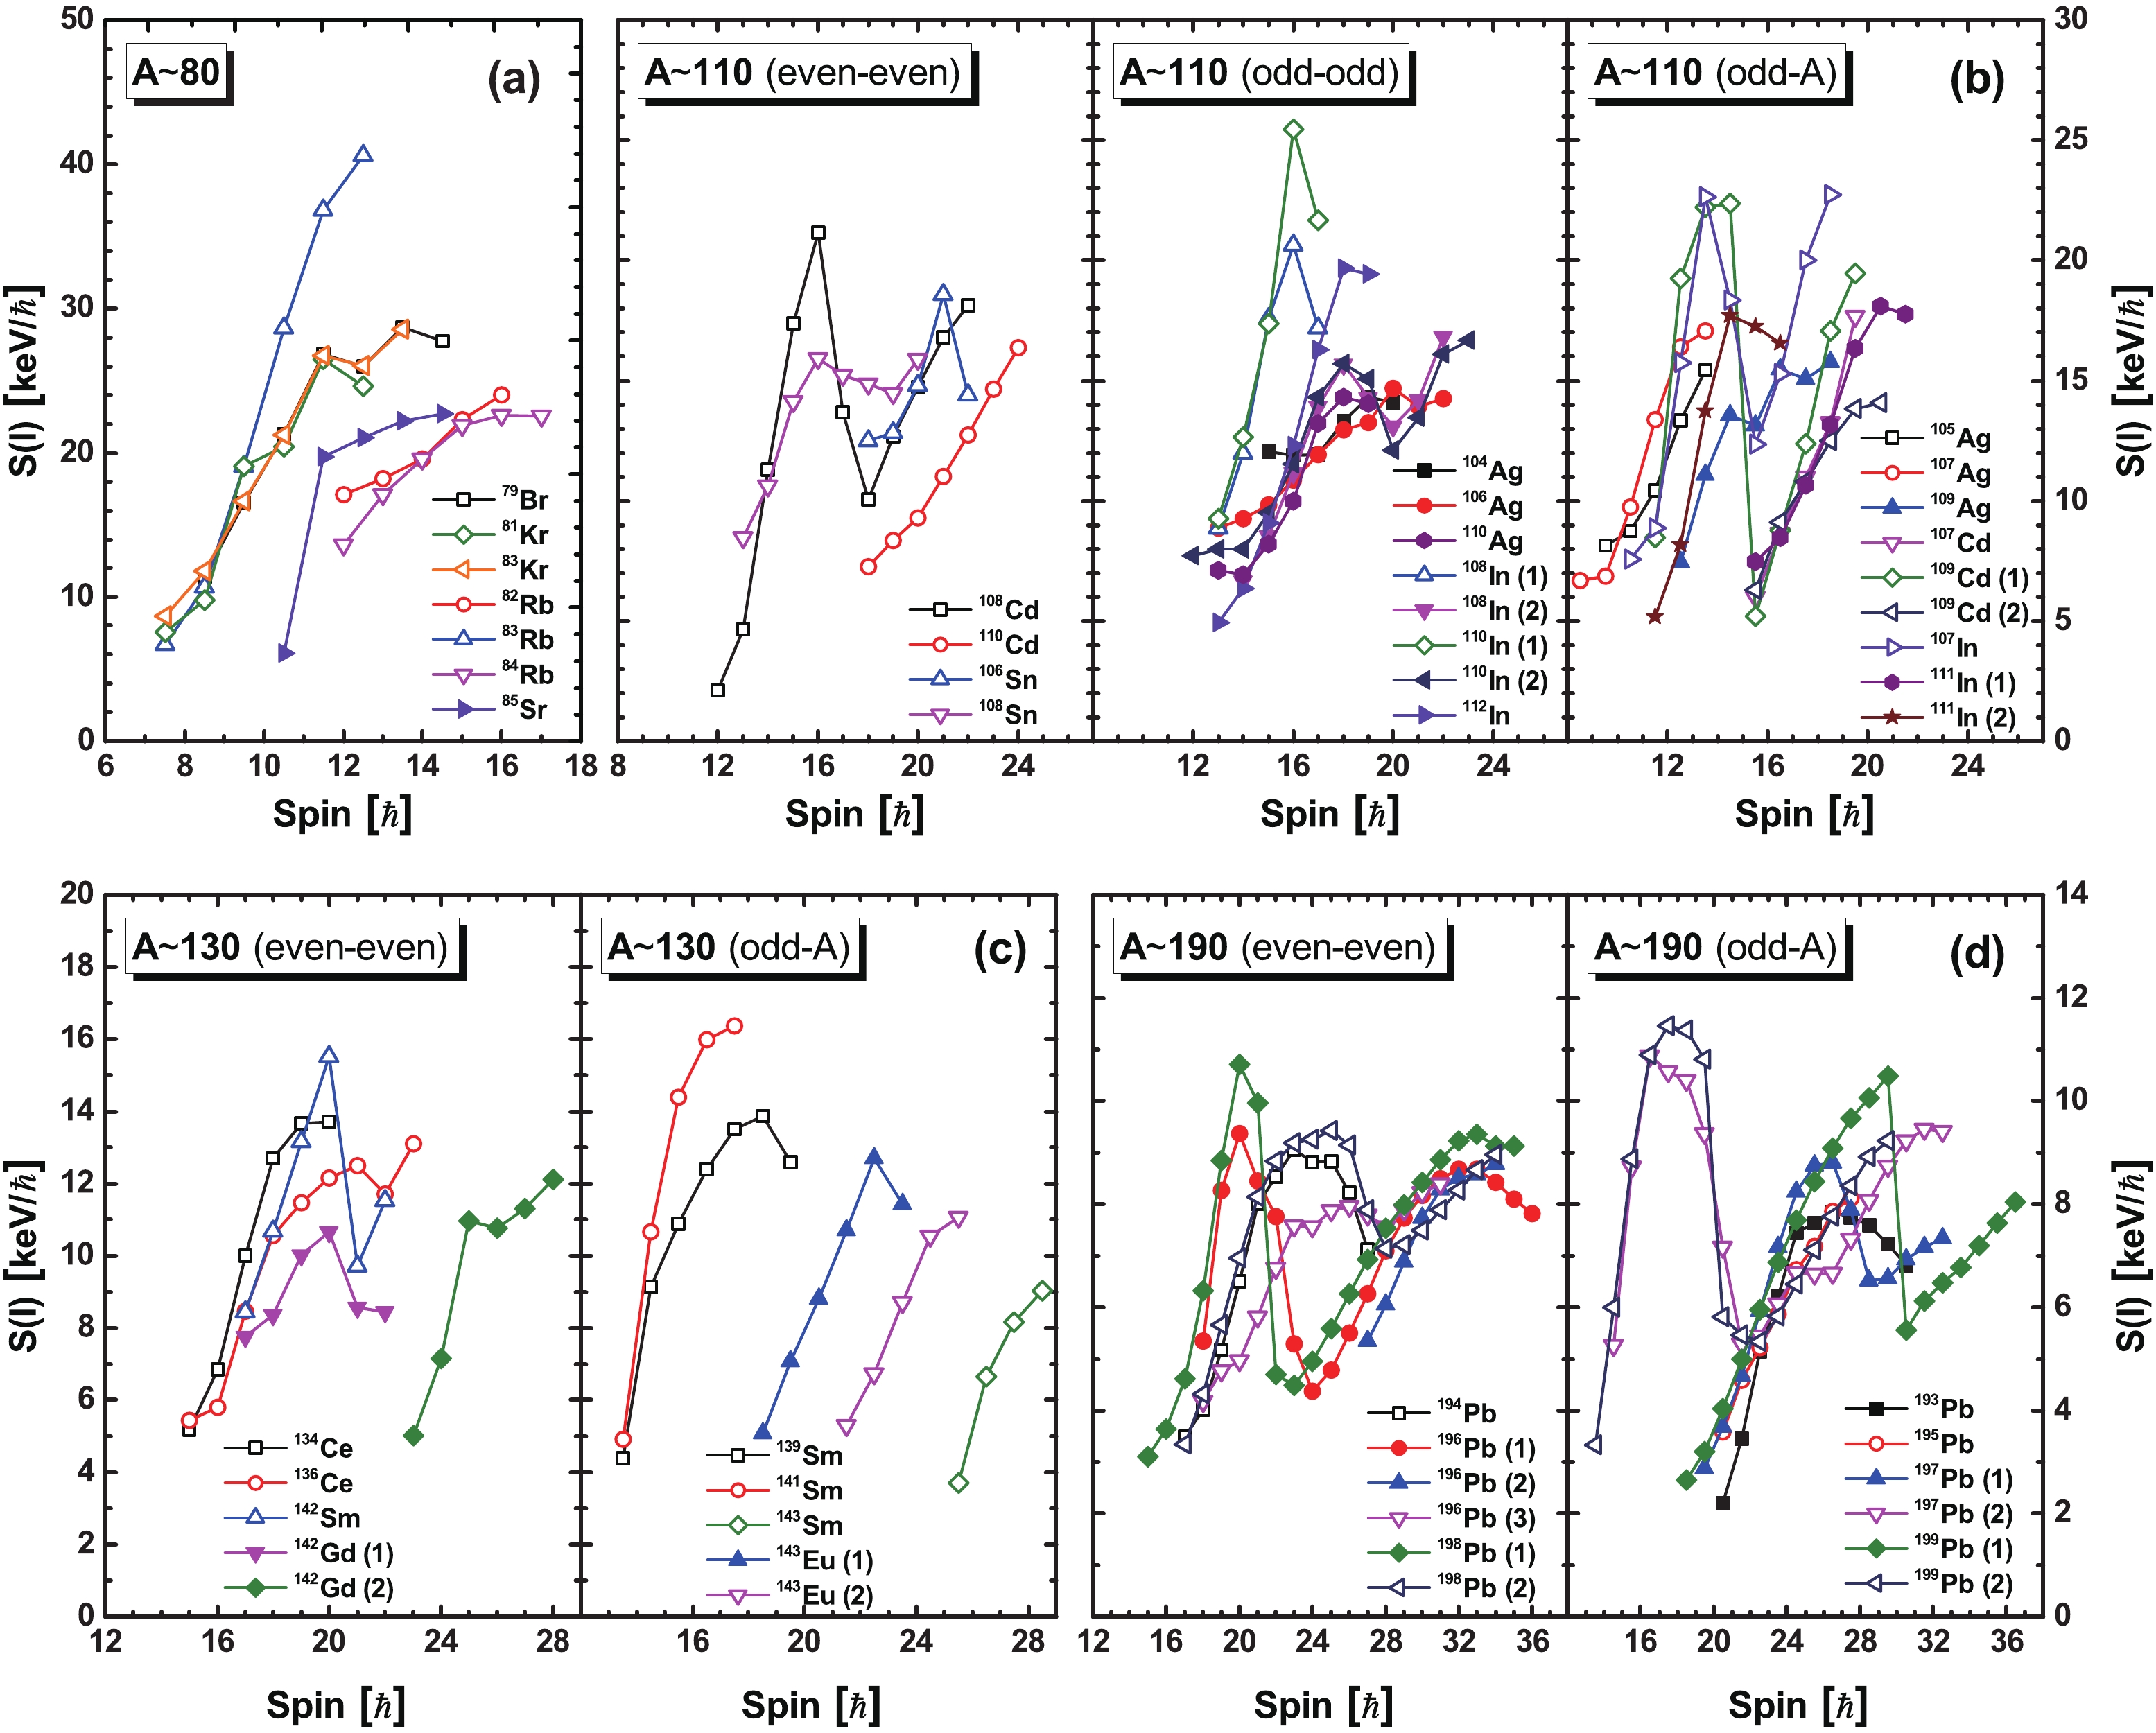
Figure 2. (color online) Experimental energy staggering
S(I) as a function of spin I for good candidate MR bands in the mass numberA∼80 (a), 110 (b), 130 (c) and 190 (d) regions. In the 110, 130, and 190 mass regions, MR bands in even-even, odd-odd, and odd-A nuclei are presented separately. The filled and open symbols depict positive parity bands and negative parity bands, respectively. The corresponding data are taken from the previous review Ref. [12] and recent observations [15–29, 56–58].Figure 2 shows that for almost all the MR candidates, the experimental energy staggering
S(I) tend to increase with increasing spin except for the backbend regions (or band crossing), in agreement with the semi-classical formula for the rotational-like properties of MR, i.e., the deduced termS(I)∝1−(2I0+1)/2I , and differently from the semi-classical formula for conventional rotation in well-deformed nuclei. For example, for the MR bands of79Br ,81,83Kr ,82,83,84Rb , and85Sr in the 80 mass region,S(I) clearly exhibits an increasing pattern as the spin increases. In Ref. [59], the semiclassical approach using two blades (particle and hole) interacting with an effective force is proposed, and this simple scenario can account for the important features of the shears bands in neutron-deficient Pb nuclei and other mass regions. In fact, the moment of inertia in the shears mechanism would decrease with the closing of the shears blades [7, 59]. The behavior where the kinematic moment of inertiaJ(1)(=1/[2S(I)]) decreases with angular momentum is clearly demonstrated in Ref. [59], which further proves the increasing feature ofS(I) with spin. However,S(I) for the MR band in108Sn [60] shown in Fig. 2(b) is an exception, i.e., in the higher spin region of the band,S(I) begins to decrease, whileB(M1) still shows a decreasing tendency.The
S(I) values in the backbend region show a decreasing trend with increasing spin for the MR bands in the 110, 130, and 190 mass regions. The backbend phenomenon is usually interpreted as the decoupling of a pair of particles from the rotating nuclear core and the subsequent rotational alignment of their angular momenta along the rotation axis [61]. The backbend would result in an increasing moment of inertia caused by the shears opening due to the gradual alignment of the particles, and thereforeS(I) shows the decreasing trend in the backbend regions of MR bands. For example, theS(I) of the negative-parity MR band of199Pb decreases from 11.5 to 5.3keV/ℏ in the backbend region [62], as shown in Fig. 2. Here, the configurations of the negative-parity MR band in199Pb areπ(h9/2i13/2)K=11−⊗νi−113/2 before the backbend (I⩽17.5ℏ ) andπ(h9/2i13/2)K=11−⊗νi−313/2 after the backbend (I⩾23.5ℏ ), respectively [62]. After the rotational alignment of twoi13/2 neutron holes, the shears open up to90∘ coupling, and a new shears band starts building up.In addition, it is easy to see in Fig. 2 that the
S(I) values in higher mass regions are relatively smaller compared to those in lower mass regions. In theA∼80 region,S(I) varies from 8 to 42keV/ℏ and it varies from 2 to 25keV/ℏ in theA∼110 region. Then, in theA∼130 region,S(I) varies from 4 to 16keV/ℏ , and finally it varies from 2 to 12keV/ℏ in theA∼190 region. This behavior is closely related to the mass dependence of the moment of inertia for these bands, as discussed in Ref. [55]. Moreover,S(I) is also related to the corresponding valence particle-hole configuration. For example, for the positive-parity band in108,110,112In [18, 19] with the same configurationπg−19/2⊗νh211/2(g7/2/d5/2)1 , theS(I) values of these bands are quite similar, as shown in Fig. 2(b). Meanwhile for the two bands with different configurations in the same nuclide108In , there is a clear discrepancy in theS(I) values.However, some MR bands in Fig. 2 show abnormal behaviours of
S(I) for the band termination (high spin) region. For example, a sudden decline inS(I) occurs at the highest spin (I=23.5ℏ ) of the MR band of143Eu in Fig. 2(c), orS(I) decreases in the high-spin region (I>26.5ℏ ) of193Pb in Fig. 2(d). Similar behaviors are observed in104Ag ,110,111,112In ,106Sn ,136Ce ,139Sm ,142Gd , and194,196,198Pb . The decreasing tendency ofS(I) in the high-spin region of the bands, in some cases a sudden decline at the highest spin, are mostly caused by the abrupt change of the configuration, which is similar to the pattern ofS(I) in the backbend region. For the MR band of109Ag in Fig. 2(b),S(I) shows a staggering pattern in the high-spin region (I⩾15.5ℏ ), which is also found in79Br ,81,83Kr ,105,106,107Ag , and136Ce , as shown in Fig. 2. In Ref. [63], it is noted that the competition and interaction with collective rotations happen in the high-spin region of the bands with a certain configuration, as aligned states do not have the maximum spin.In all the presented MR bands, the increasing tendency of energy staggering
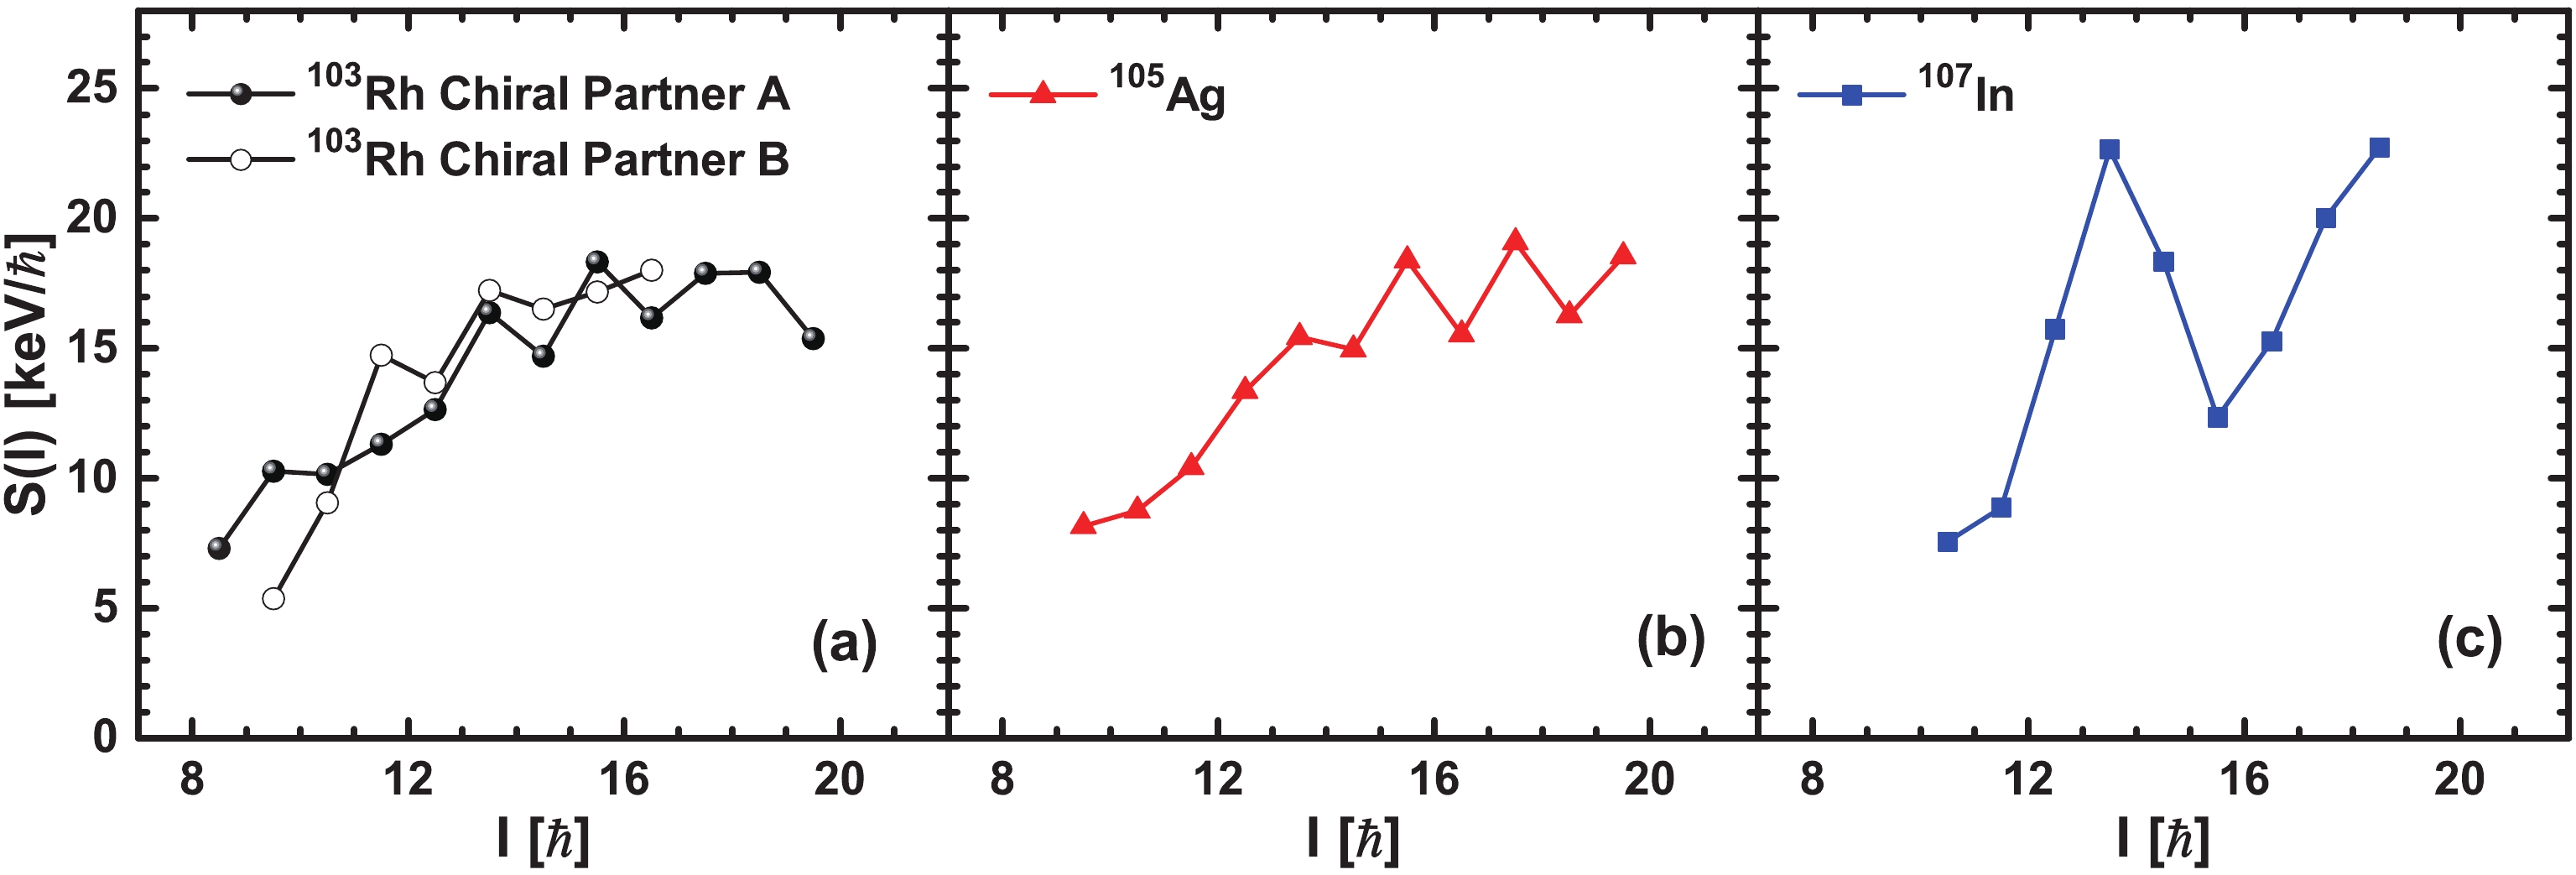
S(I) with increasing spin before and after the backbend are observed. The systematic study of the energy staggering parameter in MR bands shows a common behavior ofS(I) , implying thatS(I) could be a potential indicator for MR. Therefore, it is necessary to test and compare with other exotic rotations, such as chiral rotation [64]. Taking theM1 bands in103Rh [65],105Ag [20, 66, 67], and107In [24, 68] with the same configurationπg−19/2⊗νh111/2(g7/2/d5/2)1 as examples, the extracted experimentalS(I) values are shown and compared in Fig. 3. -
The two
M1 bands of103Rh have been proposed as chiral doublet bands [65]. Multiple chiral doublet bands with the same configurationπg−19/2⊗νh111/2(g7/2/d5/2)1 were observed in103Rh , and only the "yrast" chiral doublet bands are presented here. TheS(I) values of those two chiral partner bands in Fig. 3(a) remain almost constant with a little staggering, andB(M1)/B(E2) ratios show typical values and behaviors of chiral doublet bands, as suggested in Ref. [65].For the
M1 band of107In , theS(I) values increase with increasing spin before and after the backbend. The behaviors of the experimental data in this band, includingB(M1)/B(E2) ratios andB(M1) values, are consistent with ideal MR bands, as suggested in Ref. [24].For the
M1 band of105Ag , theS(I) values of theM1 band tend to increase with increasing spin in the lower spin region, which is consistent with the behavior in ideal MR bands. In the higher spin region (I>15.5ℏ ),S(I) shows noticeable staggering. The staggering ofS(I) is usually considered as a sign of the collective rotation, which indicates a competition between the shears mechanism and collective motion.The single-particle Routhians for the proton at the top of the
πg7/2 shell is close to theπg9/2 proton shell. Considering that the contribution from collective motion is increasing, there can be a mixing of the configurationπg−19/2⊗νh111/2(g7/2/d5/2)1 and the configurationπg17/2⊗ νh111/2(g7/2/d5/2)1 at high-spin states.Based on the above statements, the shears mechanism does not seem to dominate in the
M1 bands of103Rh and105Ag , and there is an obvious transition from chiral rotation to magnetic rotation in theA∼110 region, when the proton number is approaching Z = 50. Moreover, the quadrupole deformation in previous TAC calculations are 0.26, 0.19, and 0.12 for103Rh [65],105Ag [69] and107In [24] with the same configurationπg−19/2⊗νh111/2(g7/2/d5/2)1 , respectively. This probably indicates that the deformation of nuclei becomes smaller with increasing Z number towards Z = 50. Similarly to Refs. [21, 70], the increasing importance of the shears mechanism and decreasing contribution of collective rotation with increasing proton number towards Z = 50 in theA∼110 region have also been presented and discussed. Thus, the systematic study of the different rotational modes in theA∼110 region is an interesting question. -
During the past few decades, the relativistic mean-field (RMF) theory has been a great success in describing properties of nuclei and many nuclear phenomena [71–73]. The principle axis cranking relativistic mean-field (PAC-RMF) theory has been used to describe collective rotational motion in deformed nuclei [74]. Based on the RMF theory, the tilted axis cranking relativistic mean-field (TAC-RMF) theory has been developed for describing nuclear magnetic and antimagnetic rotational modes [9, 10]. The cranking RMF model with arbitrary orientation of the rotational axis, i.e., three-dimensional cranking, has been developed and applied for the magnetic rotation in
84Rb [75]. Recently, the three-dimensional TAC-RMF theory with the point-coupling interaction has been used to investigate multiple chirality in nuclear rotation [76, 77]. The two-dimensional cranking RMF theory based on the meson exchange [78] and the point-coupling interactions [79, 80] has also been established and applied successfully to describe magnetic rotation inA∼60 , 80, 130, and 190 regions [9, 10], and especially the 110 region [28, 80–86].To further examine the rotational mechanism, as well as the staggering pattern of
S(I) for the band in105Ag , the TAC-RMF calculations for the lower spin region of the dipole band in105Ag with the configurationπg−19/2⊗ νh111/2(g7/2/d5/2)1 and the principle axis cranking RMF (PAC-RMF) calculations for the higher spin region of the band with the configurationπg17/2⊗νh111/2(g7/2/d5/2)1 in different signatures have been performed. The point-coupling interaction PC-PK1 [87] was used, and pairing correlations were neglected. The Dirac equation for the nucleons is solved in a three-dimensional harmonic oscillator basis, and a basis of ten major oscillator shells is adopted. The calculated rotational excitation energies, total angular momenta andB(M1) values in comparison with the corresponding data [20, 66, 67] are shown in Fig. 4. The results of TAC-RMF calculations for the lower spin region and PAC-RMF calculations for the higher spin region in theM1 band are displayed. The experimental rotational frequency can be extracted as in Ref. [88]:ℏωexp=12[Eγ(I+1→I)+Eγ(I→I−1)] .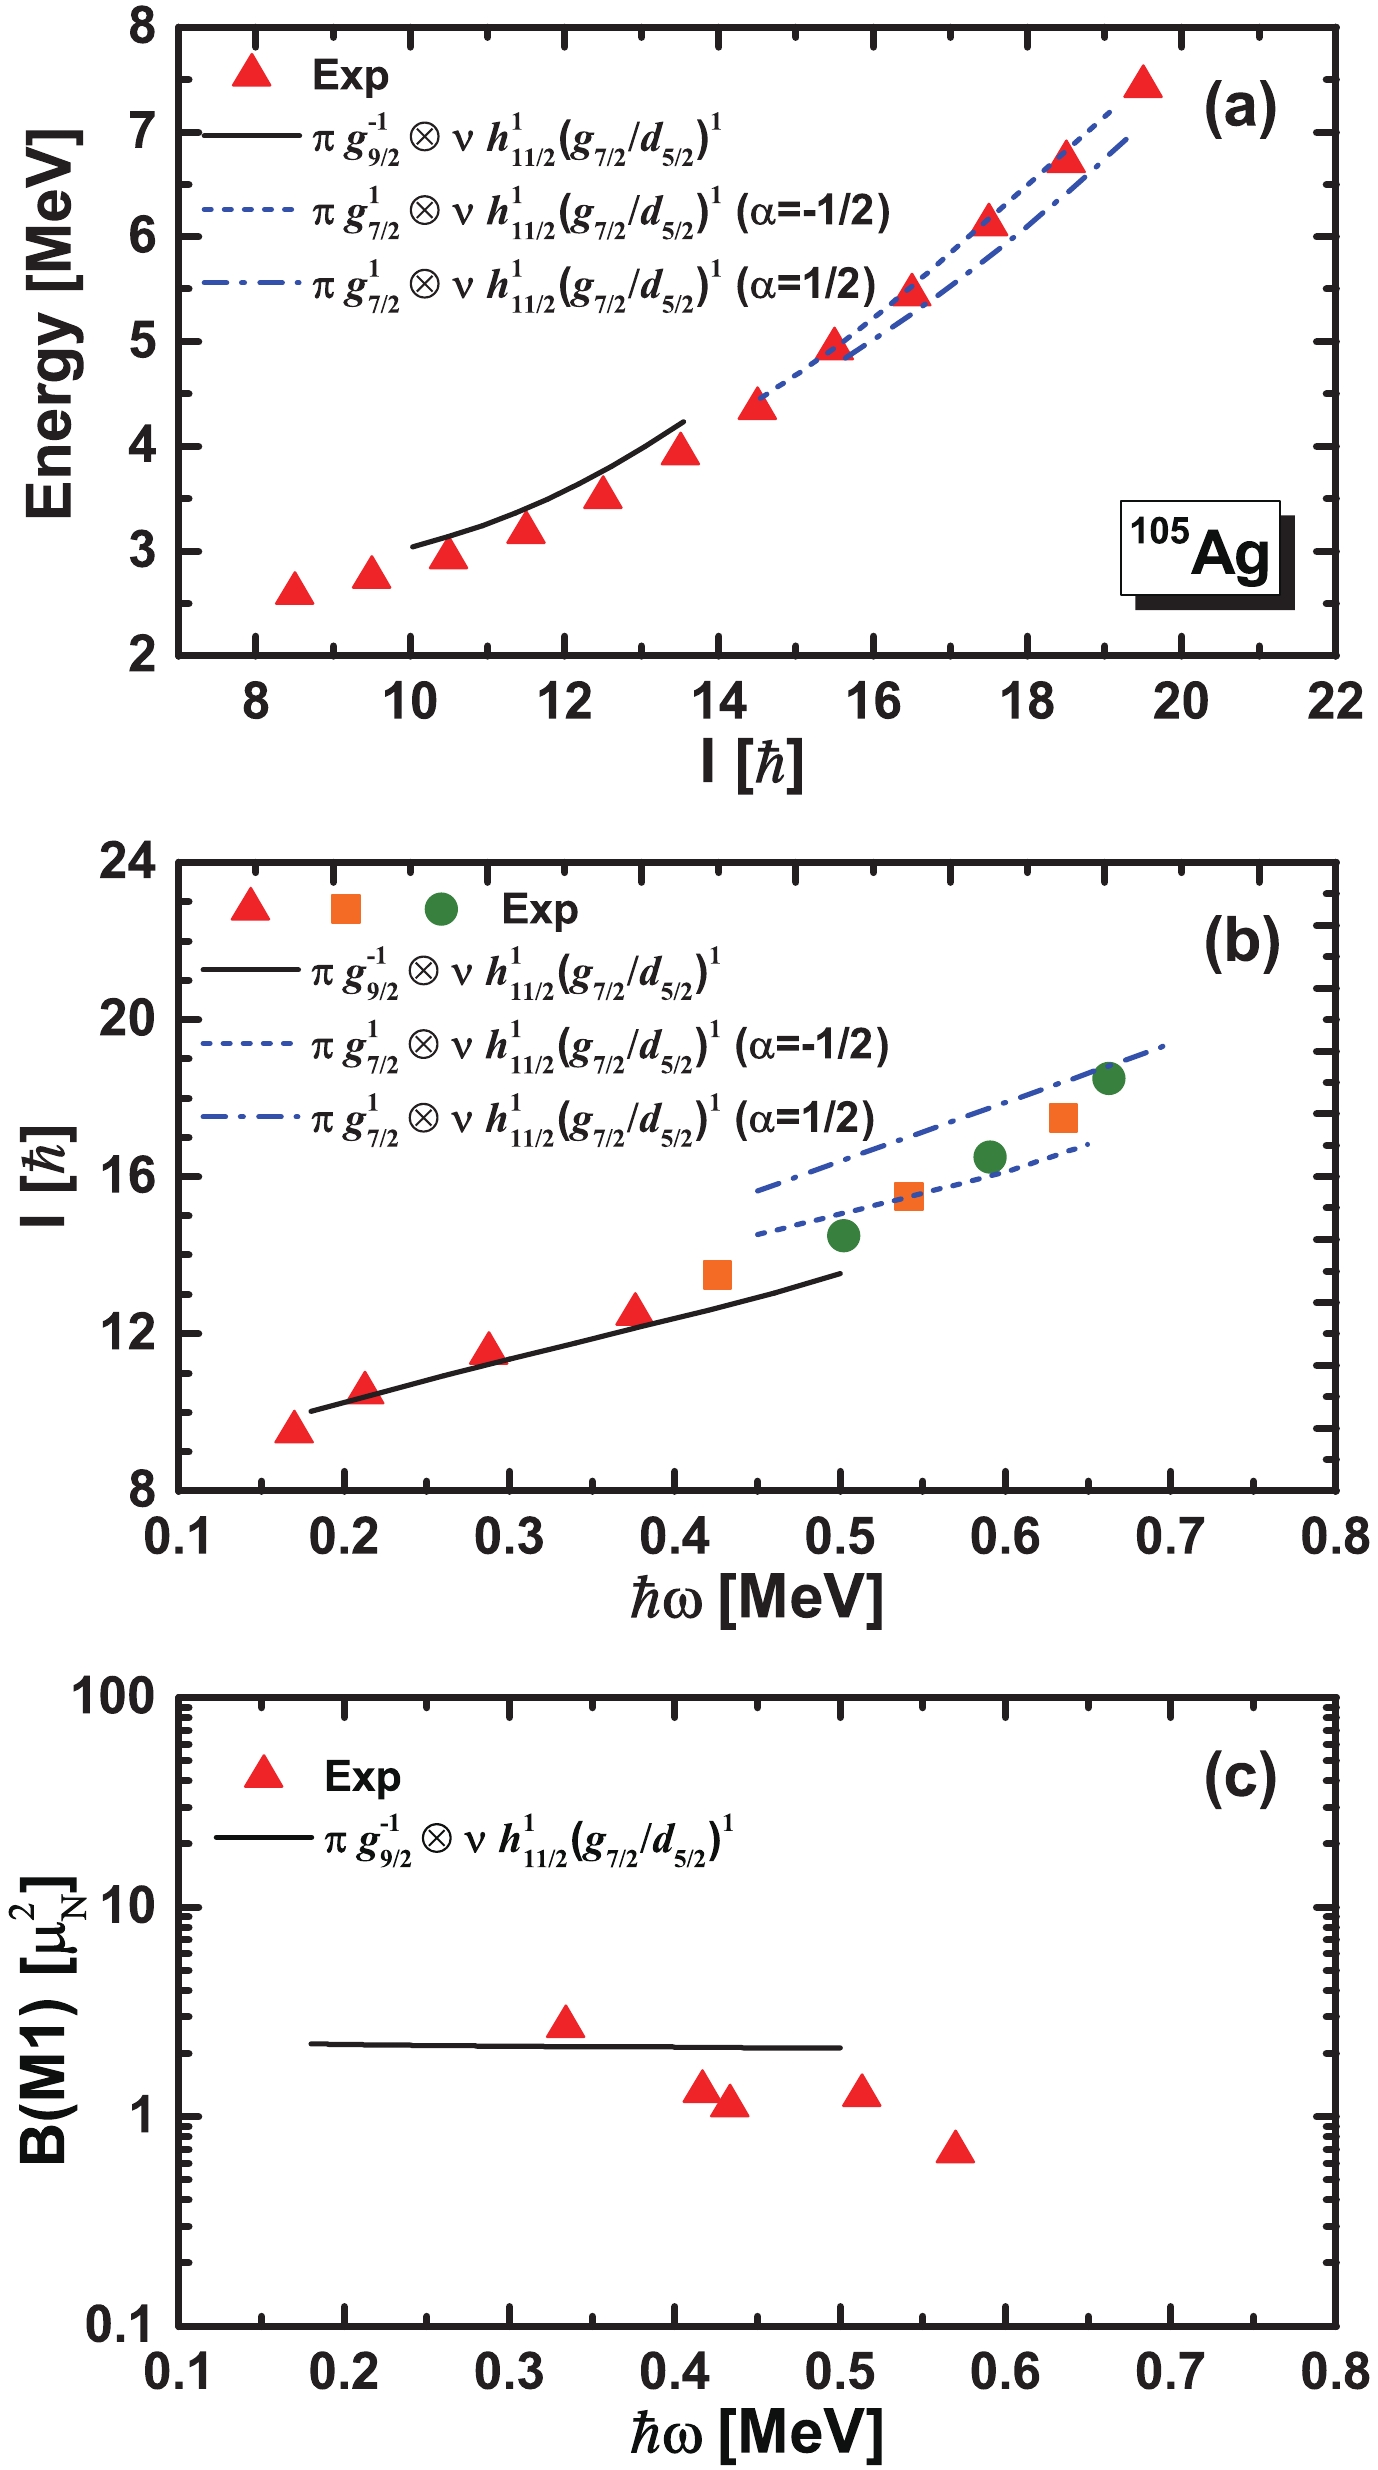
Figure 4. (color online) Rotational excitation energies (a) as a function of the total angular momentum, total angular momenta (b), and
B(M1) values (c) as functions of the rotational frequency, for the configurationsπg−19/2⊗νh111/2(g7/2/d5/2)1 in TAC-RMF calculations andπg17/2⊗νh111/2(g7/2/d5/2)1 in PAC-RMF calculations. The corresponding data are taken from Refs. [20, 66, 67].Figure 4(a) shows that the calculated excitation energies of the band in both TAC-RMF and PAC-RMF calculations are both in good agreement with experimental data. In Fig. 4(b), for the lower spin region, the TAC-RMF results reproduce the data well, which further supports the significant contribution from shears mechanism. For the higher spin region, the PAC-RMF results are in reasonable agreement with the data, indicating that the increasing contribution from the collective motion results from the intruder configuration
πg17/2⊗νh111/2(g7/2/d5/2)1 . Moreover, the experimentalI−ω plot is sandwiched between the corresponding plots for the configurationπg−19/2⊗νh111/2(g7/2/d5/2)1 andπg17/2⊗νh111/2(g7/2/d5/2)1 , further supporting the mixing of these two configurations at high-spin states.In Fig. 4(c), the calculated
B(M1) values are shown to be in agreement with the data, however they do not decrease much with increasing rotational frequency, corresponding to a small decline in the shears angle. As discussed in Ref. [78], the tilted angleθ of the orientation of the angular velocity with respect to the principal axis of the density distribution is determined self-consistently in the TAC-RMF calculations. With the rotational frequency increasing from 0.18 to 0.50 MeV/ℏ , the tilted angle of the proton angular momentumθπ changes from5∘ to10∘ , and the tilted angle of neutron angular momentumθν decreases from81∘ to71∘ . The shears angle between these two blades decreases from76∘ to61∘ , i.e., the proton and neutron angular momenta align toward each other with increasing rotational frequency, which exhibits an apparent shears mechanism. The shears angle only decreases by a small amount due to the relatively high contribution from collective motion. In general, the TAC-RMF calculations support the MR interpretation for the lower spin region of the band. -
In summary, 50 bands spread over 39 nuclides with
M1 andE2 transition properties, which are strictly consistent with the features of MR, have been selected, and a systematic study of energy staggering parameterS(I) in these bands has been performed. The present study shows thatS(I) values increase with increasing spin for all the bands before and after backbends, which could be explained by the simple semiclassical description of the shears mechanism. This could be treated as an indicator for MR, and also requires more investigations. Moreover, the behaviors ofS(I) in the backbend regions or close to band termination have been discussed. In addition, theM1 bands in three N = 58 isotones, i.e.,103Rh ,105Ag , and107In , with the same configurationπg−19/2⊗νh111/2(g7/2/d5/2)1 are taken as examples to further examine the staggering behaviours ofS(I) in different rotational modes. It is suggested that there is a transition from chiral rotation to magnetic rotation with the proton number approaching Z = 50, due to the competition between the collective motion and the shears mechanism. Furthermore, the TAC-RMF and PAC-RMF calculations have been performed, and the rotational modes in105Ag are clearly shown.The authors would like to thank Dr. P. W. Zhao and Y. K. Wang for helpful discussions and collaboration during the completion of this work.
Energy staggering parameters in nuclear magnetic rotational bands
- Received Date: 2019-04-15
- Accepted Date: 2019-06-26
- Available Online: 2019-09-01
Abstract: This study presents the systematics of energy staggering for magnetic rotational bands with


 DownLoad: