


 Abstract
 HTML
HTML Reference
 Related
 PDF
PDF


-
The beta decay antineutrino energy loss rates (AELR) of 56V, 56Cr, 56Mn, 56Fe, 56Co, and 56Ni are key parameters in numerical simulation of supernova. The neutrinos and antineutrinos are transparent to the stellar matter and cause stellar core cooling. The neutrino energy loss rates caused by the beta decay and electron capture (EC) in presupernova have been investigated in previous studies (e.g., Fuller et al. [1, 2] (FFN) ; Aufderheide et al. [3, 4] (AUFD); Langanke et al. [5, 6]). In our previous studies [7–9], we have discussed the electron capture and beta decay reactions along with the related issues. The AELR by EC has likewise posed an interesting problem in the investigation of cooling of a neutron star [10–13], because the EC rates could be affected by many factors, such as density of the matter, electron fractions [14–16], temperature, and magnetic field strength, which may in turn influence the equation of state and spin evolution of the star [17-20]. However, all of the studies mentioned above neglected the effect of strong electron screening (SES) on the neutrino energy loss rates.
Some astrophysicists (e.g., studies depicted Refs. [20–26]) discussed the SES problem in detail. Many works (e.g., Refs. [27–30]) also addressed the the effects of ion and electron screening on thermonuclear reaction rates. However, these studies did not consider the influence of SES on the chemical potential, Q-value, shell and pair effects. The SES strongly influences the beta decay threshold energy and the chemical potential. Thus, it is very important to accurately investigate the beta decay neutrino energy loss in the SES.
Our previous studies [31, 32] demonstrated that the SES affects the beta decay rates and neutrino cooling to a great degree. However, these studies neglected the SES effect on the chemical potential in the beta decay. Toki et al. [33] have calculated
β -transition rates for the URCA process using thes−d shell model. They considered manyβ− transitions, including excited states necessary for the electron capture andβ− decay at high density and high temperature. Recently, Suzuki et al. [34] also evaluated the electron capture andβ -decay rates based on thes−d shell model for electron-degenerateO−Ne−Mg cores with initial masses of 8–10M⨀ (M⨀ denotes the solar mass).Our studies differ from these works [33, 34] in discussing the SES effects on the beta decay and neutrino cooling. First, these works discussed the weak interaction rates for some
O−Ne−Mg nuclei based on thes−d model theory, whereas in the present paper, we focus on the some iron group nuclei and discuss the beta decay reaction based on thep−f shell model. Second, there are two Coulomb effects due to SES: one is the screening effect of the electrons, and the other is the change of threshold energy due to the change of chemical potential of the ions. Nuclear reaction rates in dense plasmas depend in a number of crucial ways on their thermodynamic functions. Enhancement due to internuclear multiparticle processes is described in terms of increments in the excess of chemical potentials before and after nuclear reactions. Screening distances of internuclear potentials are likewise described by the compressibility of the electron gas. These studies discussed the effect caused by the correction of the chemical potential of the nucleus due to the interactions between nucleus and electron background based on the Ichimaru model [35]. We discussed the SES problem based on the Potekhin model [36, 37]. The polarizable electron background is calculated for ion chargesZ=26 and a wide domain of plasma parameters ranging from the Debye limit to the crystallization point. Our calculations are based on the linear-response theory for the electron-ion interaction, including the local-field corrections in the electronic dielectric function. Finally, their studies only discussed the effect of SES on the weak interaction reaction and the neutrino cooling by considering the corrections of the Q-value, electron chemical potential, and the electron energy. Following the study from Ref. [38], we calculate the half-lives of some iron group nuclei ofβ− -decay, taking into account shell and pair effects. Based on the ion ball screening model (IBSM) (i.e., SES model(I)) [10], and the linear-response theory model (LRTM)(i.e., SES model(II)) [36, 37, 39], we calculate the screening corrections to AELR byβ− decay for 56V, 56Cr, 56Mn, 56Fe, 56Co, and 56Ni. We also discuss and compare the results of model (I) with those of the SES model (II).The SES model (I) is mainly focused on the screening electrostatic potential per electron under the Wigner-Seitz approximation and Q-value correction based on the IBSM from Ref. [20]. The SES model (II) is mainly focused on the linear response theory by considering the effect of the SES on the Q-value and Coulomb chemical potential due to the change of Coulomb free energy (see Refs. [36, 37, 39] for a detailed discussion)
We organize this paper as follows. In Section 2, we study the beta decay AELR and the half-lives in the absence of SES. In Section 3, we discuss the screening potential, and the screening corrections to the Q-value and the AELR for the model (I). In Section 4, we discuss the AELR and the screening corrections of the Q-value, the electron chemical potential for the model (II). We analyze the influence of SES on the AELR. Our results and discussions are provided in Section 5. In Section 6, we present our conclusions.
-
In the absence of SES, the AELR by
β− decay at temperatureT is given by (e.g., Refs. [1-4])λ0AELR=ln2∑(2Ji+1)e−EikBTG(Z,A,T)∑fξ(ρ,T,Ye,Qij)ftij,

(1) where
G(Z,A,T) is the nuclear partition function;Z,A,T are the electric charge on nucleus, mass number, and the temperature, respectively;ftij is the comparative half-life connecting states ofi andj ;kB is the Boltzmann constant, andJi is the spin.Qij is the nuclear energy difference between the states ofi andj , respectively.Q00=Mpc2−Mdc2 ,Mp andMd are the masses of the parent nucleus and the daughter nucleus, respectively,Ei andEj , are the excitation energies of thei th andj th nuclear state. Theξ(ρ,T,Ye,Qij) in Eq.(1) for the AELR byβ− decay isξ(ρ,T,Ye,Qij)=c3(mec2)5∫Qij1dεeεe(ε2e−1)1/2×(Qij−εe)3F(Z+1,εe)1+exp[(UF−εe)/kBT],

(2) where
F(Z+1,εe) is the Coulomb wave correction.εe is the electron energy, andUF,me,p are the electron's chemical potential, mass, and momentum, respectively.In the pre-collapse phase, the electron chemical potential is given by [30]
UF=1.11(ρ7Ye)1/3[1+(π1.11)(kBT)2(ρ7Ye)2/3]−1/3MeV.

(3) Ref. [38] discussed the beta-decay half-lives of the r-process nuclei with a consideration of the shell and pair effects, as well as the decay energy
Q . Then, the comparative half-lifeftij is written asln(ftij)=a1+(α2Z2−5+a2N−ZA)ln(Qif−a3δ)+(a4α2Z2)+13α2Z2ln(A)−αZπ+S(N,Z),

(4) where the fine structure constant
α=1/137 , andδ=(−1)N+(−1)Z . Taking into account the pairing effects on Q-values, and the shell effects, the correction factorS(N,Z) is written as [28]S(N,Z)=a5exp(−((N−28)2+(N−20)2)/12)+a6exp(−((N−50)2+(N−38)2)/43)+a7exp(−((N−82)2+(N−50)2)/13)+a8exp(−((N−82)2+(N−58)2)/24)+a9exp(−((N−110)2+(N−70)2)/244),

(5) where
ai(i=1,2,3,...9) are 11.09, 1.07, −0.935, −5.398, 3.016, 3.879, 1.322, 6.030, 1.669, respectively, in Eqs.(4–5). -
The free electron gas is relativistic and completely degenerated in a supernova. The incoming (outgoing) electrons in the EC (beta decay) process mainly originate from near the Fermi surface. Their Fermi energy is
EF>1 MeV when the density isρ>107g/cm3 . The screening electrostatic potential in the pre-supernova core is much stronger than the one in the main sequence stars. Based on the ion ball screening model (IBSM), the screening electrostatic potential per electron under the Wigner-Seitz approximation is determined by [20]D1=1.784×10⁻⁵(Z5/3AY2/3e)ρ1/3MeV.

(6) Due to the SES effect, the beta decay Q-value will change by a factor of (e.g., Refs. [1, 2])
ΔQ≈2.940×10⁻⁵Z2/3(ρYe)1/3MeV.

(7) Therefore, the Q-value of beta decay changes from
Qif toQsif(I)=Qif−ΔQ .We can not neglect the SES influence at high density, as the screening energy is high. The electron energy will change from
εe toεse(I)=εe+D1 in the beta decay. Due to SES, the threshold energy for the beta decay decreases fromQif toQsif(I)=Qif−ΔQ . Theξ(ρ,T,Ye,Qij) in Eq. (2) is also replaced byξs(ρ,T,Ye,Qsij(I)) , given byξs(ρ,T,Ye,Qsij)(I)=c3(mec2)5∫Qsij(II)+D11+D1dεseεse×((εse)2−1)1/2(Qsij−εse)3×F(Z+1,εse)1+exp[(UF−εse)/kBT].

(8) Therefore, according to Eq. (1), the AELR by beta decay in the SES is given by
λsAELR(I)=ln2∑(2Ji+1)e−EikBTG(Z,A,T)∑fξs(ρ,T,Ye,Qsij)ftsij,

(9) where
ftsij is the half-life in the SESln(ftsij)(I)=a1+(α2Z2−5+a2N−ZA)ln(Qsif−a3δ)+(a4α2Z2)+13α2Z2ln(A)−αZπ+S(N,Z).

(10) -
Itoh et al. [40] investigated the influence of the screening potential on EC by the linear-response theory model (LRTM). The condition is
T≪TF=5.930×10⁹{[1+1.018(ZA)2/3(10ρ7)2/3]1/2−1},

(11) where
TF is the electron Fermi temperature, andρ7 is the mass density in units of107g/cm3 .The static longitudinal dielectric function has been discussed by Jancovici et al. [41] for relativistic degenerate of electron fluid. Because of the SES effect, the electron potential energy is given by
V(r)=−Ze2(2kF)2kFr2π∫∞0sin[(2kFr)]qqϵ(q,0)dq,

(12) where
kF is the electron Fermi wave-number, andϵ(q,0) is Jancovici's static longitudinal dielectric function.According to the linear response theory, the screening potential is determined by
D2=7.525×10⁻³Z(10Zρ7A)13J(rs,R) (MeV),

(13) where the parameters
J(rs,R) ,rs , andR are given in Ref. [40]. Eq. (13) and10−5⩽rs⩽10−1,0⩽R⩽50 are fulfilled in the pre-supernova environment.It is well known that the SES also plays a key role in determining the thermodynamical properties at high density plasma surrounding [42]. When one includes the contribution of the SES, the chemical potential for nuclei is given by
UsF=U0F+UiC,

(14) where
U0F is the chemical potential in the absence of Coulomb effects, andΔUF is the contribution to the chemical potential due to the interaction of the nucleii with the electron background.Because the stellar core can comprise multi-component plasma, all the thermodynamic quantities are computed as the sum of the individual quantities for each species. If one further assumes that the electron distribution is not affected by the presence of the nuclear charges (uniform background approximation), the correction from Coulomb chemical potential of the nuclei
i is given by [32]UiC=kTfC(Γi),

(15) where
k is Boltzmanns constant,fC , andΓi=Z5/3iΓe are the Coulomb free energy per ion in units ofkT , and the ion-coupling parameter, respectively.Γe=e2/aekT , andae=(3/(4πne))1/3 is the electron sphere radius, whilene depicts the electron number density.According to the discussions for the Coulomb free energy, we will use the expression of (e.g., [36, 37])
fC(Γ)=−ΓecDH√Γe+acTFΓνeg1(rs)h1(x)1+[b√Γe+ag2(rs)Γe/rs]h2(x),

(16) where the parameter
cDH=Z√3[(1+Z)3/2−Z3/2−1],

(17) and the parameter
cTF determines the screening in the limit of largeΓe and smallrs , given bycTF=c∞Z7/3[1−Z−1/3+0.2Z−1/2],

(18) where
c∞=0.253 is consistent with the Thomas-Fermi approximation [20], and the parametersa=1.11Z0.475 ,b=0.2+0.078(lnZ)2 , andν=1.16+0.08ln(Z) . The functionsg1(rs) andg2(rs) are written asg1(rs)=1+0.7821+Γe(Z/rs)3(ΓeZ)1/2,

(19) and
g2(rs)=1+Z−19(1+10.001Z2+2Γe)r3s1+6r2s,

(20) respectively. In Eq. (16), the factor
h1(x)= [1+(VF/c)6Z−1/3]−1 , wherex=PF/(mec) , andPF,me,c are the zero-temperature Fermi momentum of electrons, electron mass, and the speed of light, respectively. HereVF=cx/√1+x2 is the electron Fermi velocity, andh2(x)=(1+x2)−1/2 is the relativistic correction that may be omitted whenx≪1 .The Coulomb corrections contribute to changing the threshold energy in beta decay by
ΔQsif(II)=UC(Z+1)−UC(Z).

(21) Thus, the beta-decay threshold energy becomes
Qsif(II)=Qssif=Qif+ΔQsif(II).

(22) Due to the SES, the electron energy increases from
εe toεse(II)=εsse=εe+D in beta decay, and the threshold energy decreases fromQif toQssif . The chemical potential also changes fromUF toUsF , andξ(ρ,T,Ye,Qij) is replaced byξss(ρ,T,Ye,Qssij)(II) in Eq. (2). Thus, we haveξss(ρ,T,Ye,Qssij)(II)=c3(mec2)5∫Qssij+D21+D2dεsseεsse×((εsse)2−1)1/2(Qssij−εsse)3×F(Z+1,εsse)1+exp[(UsF−εsse)/kBT].

(23) According to Eq. (1), the AELR by beta decay in the SES is given by
λsAELR(II)=ln2∑(2Ji+1)e−EikBTG(Z,A,T)∑fξss(ρ,T,Ye,Qssij)ftssij(II),

(24) where the half-life
ftssij in the SES for the model (II) isln(ftssij(II))=a1+(α2Z2−5+a2N−ZA)ln(Qssif−a3δ)+(a4α2Z2)+13α2Z2ln(A)−αZπ+S(N,Z).

(25) For the purpose of numerical simulation, we define a SES enhancement factor
C , which is expressed asC(i)=λsAELR(i)λ0AELR(i=1,2),

(26) where
i=1,2 correspond to model (I) and model (II), respectively. -
Figures 1and 2 show the ratios of
△Q/UF and (D/UF ) as a function of electron densityρ7 for the model (I). We find that△Q/UF , and (D/UF ) decrease significantly as the density increases. However, there is a small effect on△Q/UF whenρ7>10 from Fig. 1(a). Therefore, the beta decay with a low threshold energy is easier to change than that at higher density environment. Figure 1(b) also shows thatD/UF decreases with the density, and that it is hardly related with the matter density whenρ7>102 . For example,D/UF for 56Fe is 0.03281, 0.02243, 0.01847, 0.01735 atρ7=10,102,103,104 , respectively, as shown in Fig. 1. Therefore, the AELR at higher density may be less dependent on the matter density in the SES.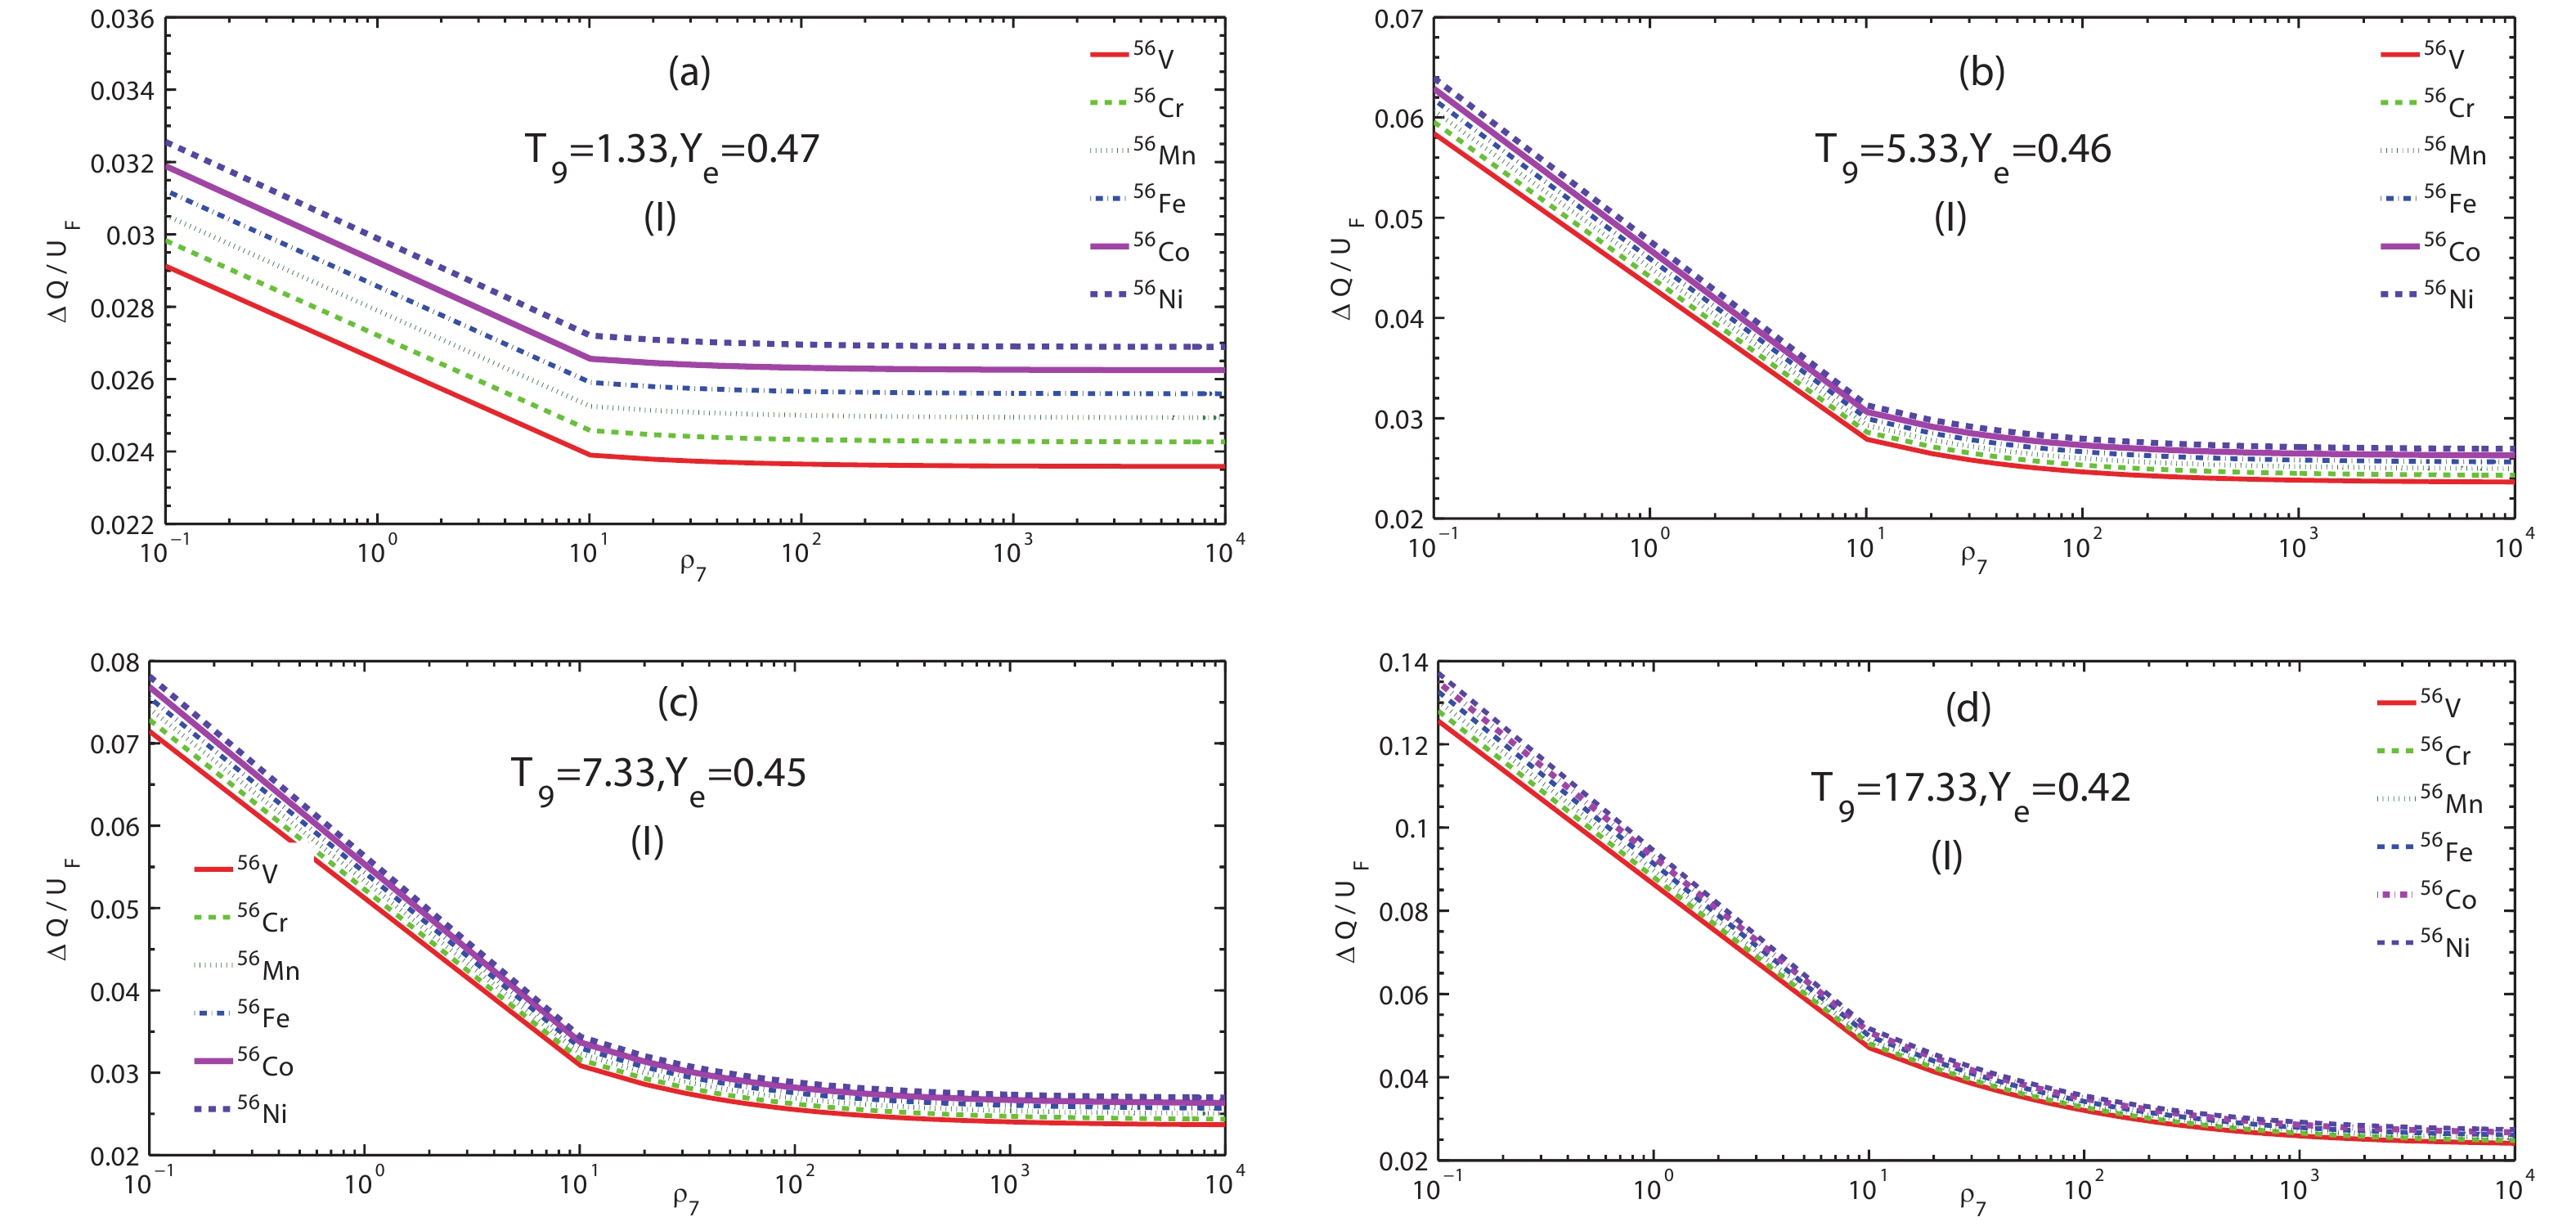
Figure 1. (color online)
△Q/UF ratio for Q-value correction, and electron Fermi energy as a function of electron densityρ7 at several typical temperature points for the model (I).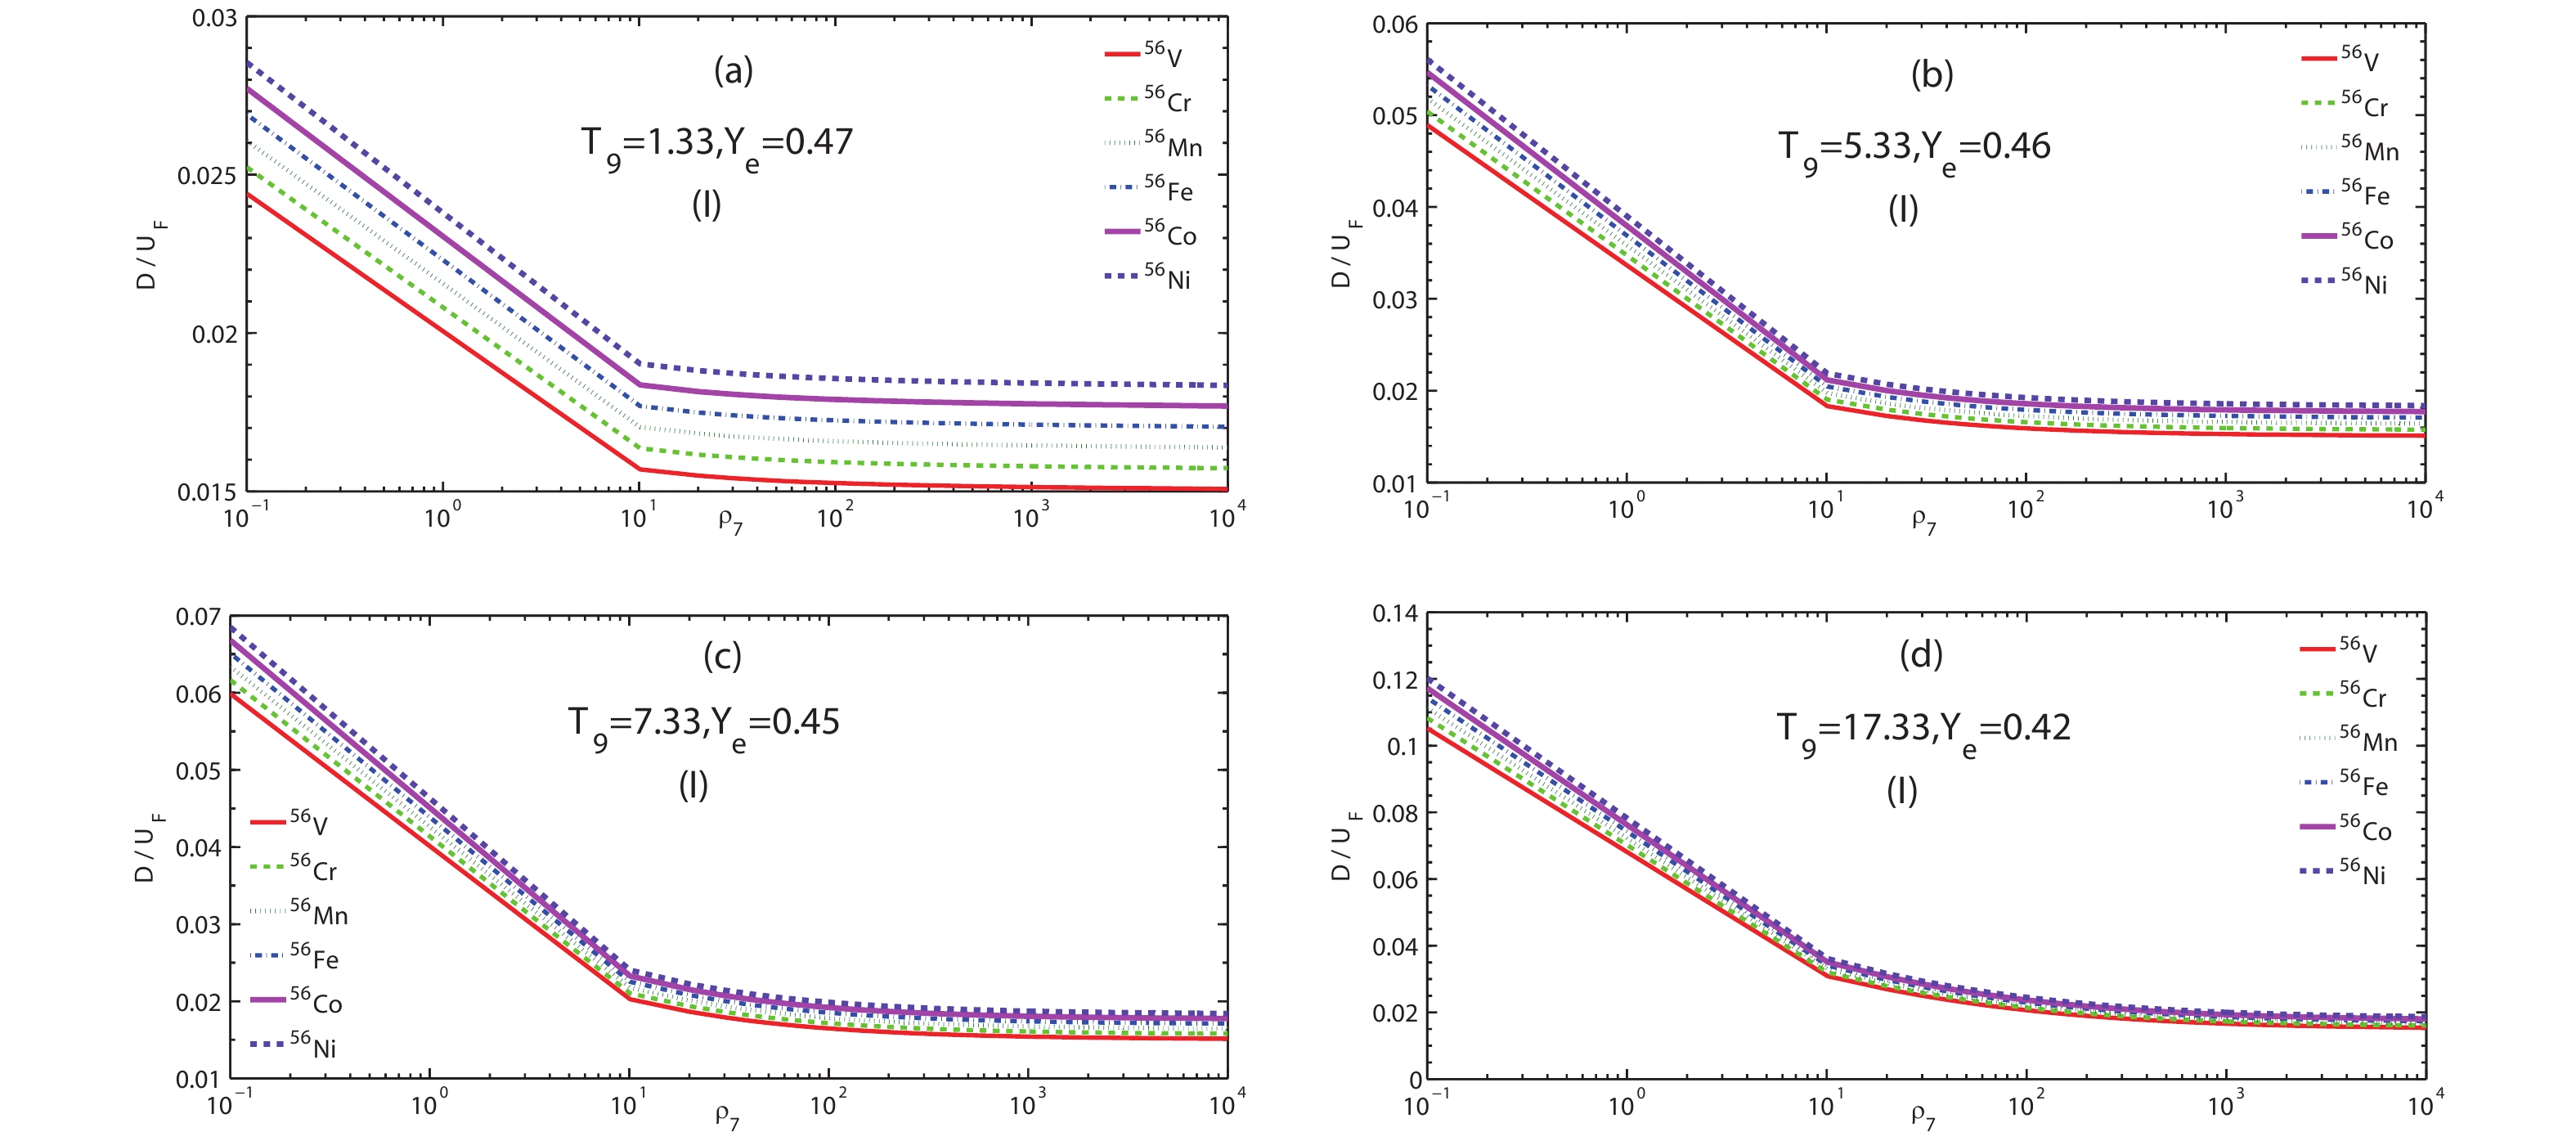
Figure 2. (color online)
D/UF ratio for screening potential, and electron Fermi energy correction as a function of electron densityρ7 at several typical temperature points for model (I).Figures 3 and 4 show the ratios
△Q/UsF , and (D/UsF ) as a function of the electron densityρ7 for the model (II).△Q/UsF , and (D/UsF ) likewise decrease significantly as the density increases. However, there is little effect on△D/UsF whenρ7>10 at a relatively higher temperature (e.g.,T9⩾5.33 ), as shown in Fig. 4. Higher temperatures lead to larger electron energy. The higher the density, the lager the electron chemical potential becomes. According to Eqs. (8, 13–19), the screening effect onD/UsF may not strongly depend on the mass density whenρ7>10 . However, the screening affects△Q/UsF significantly, as shown in Fig. 3.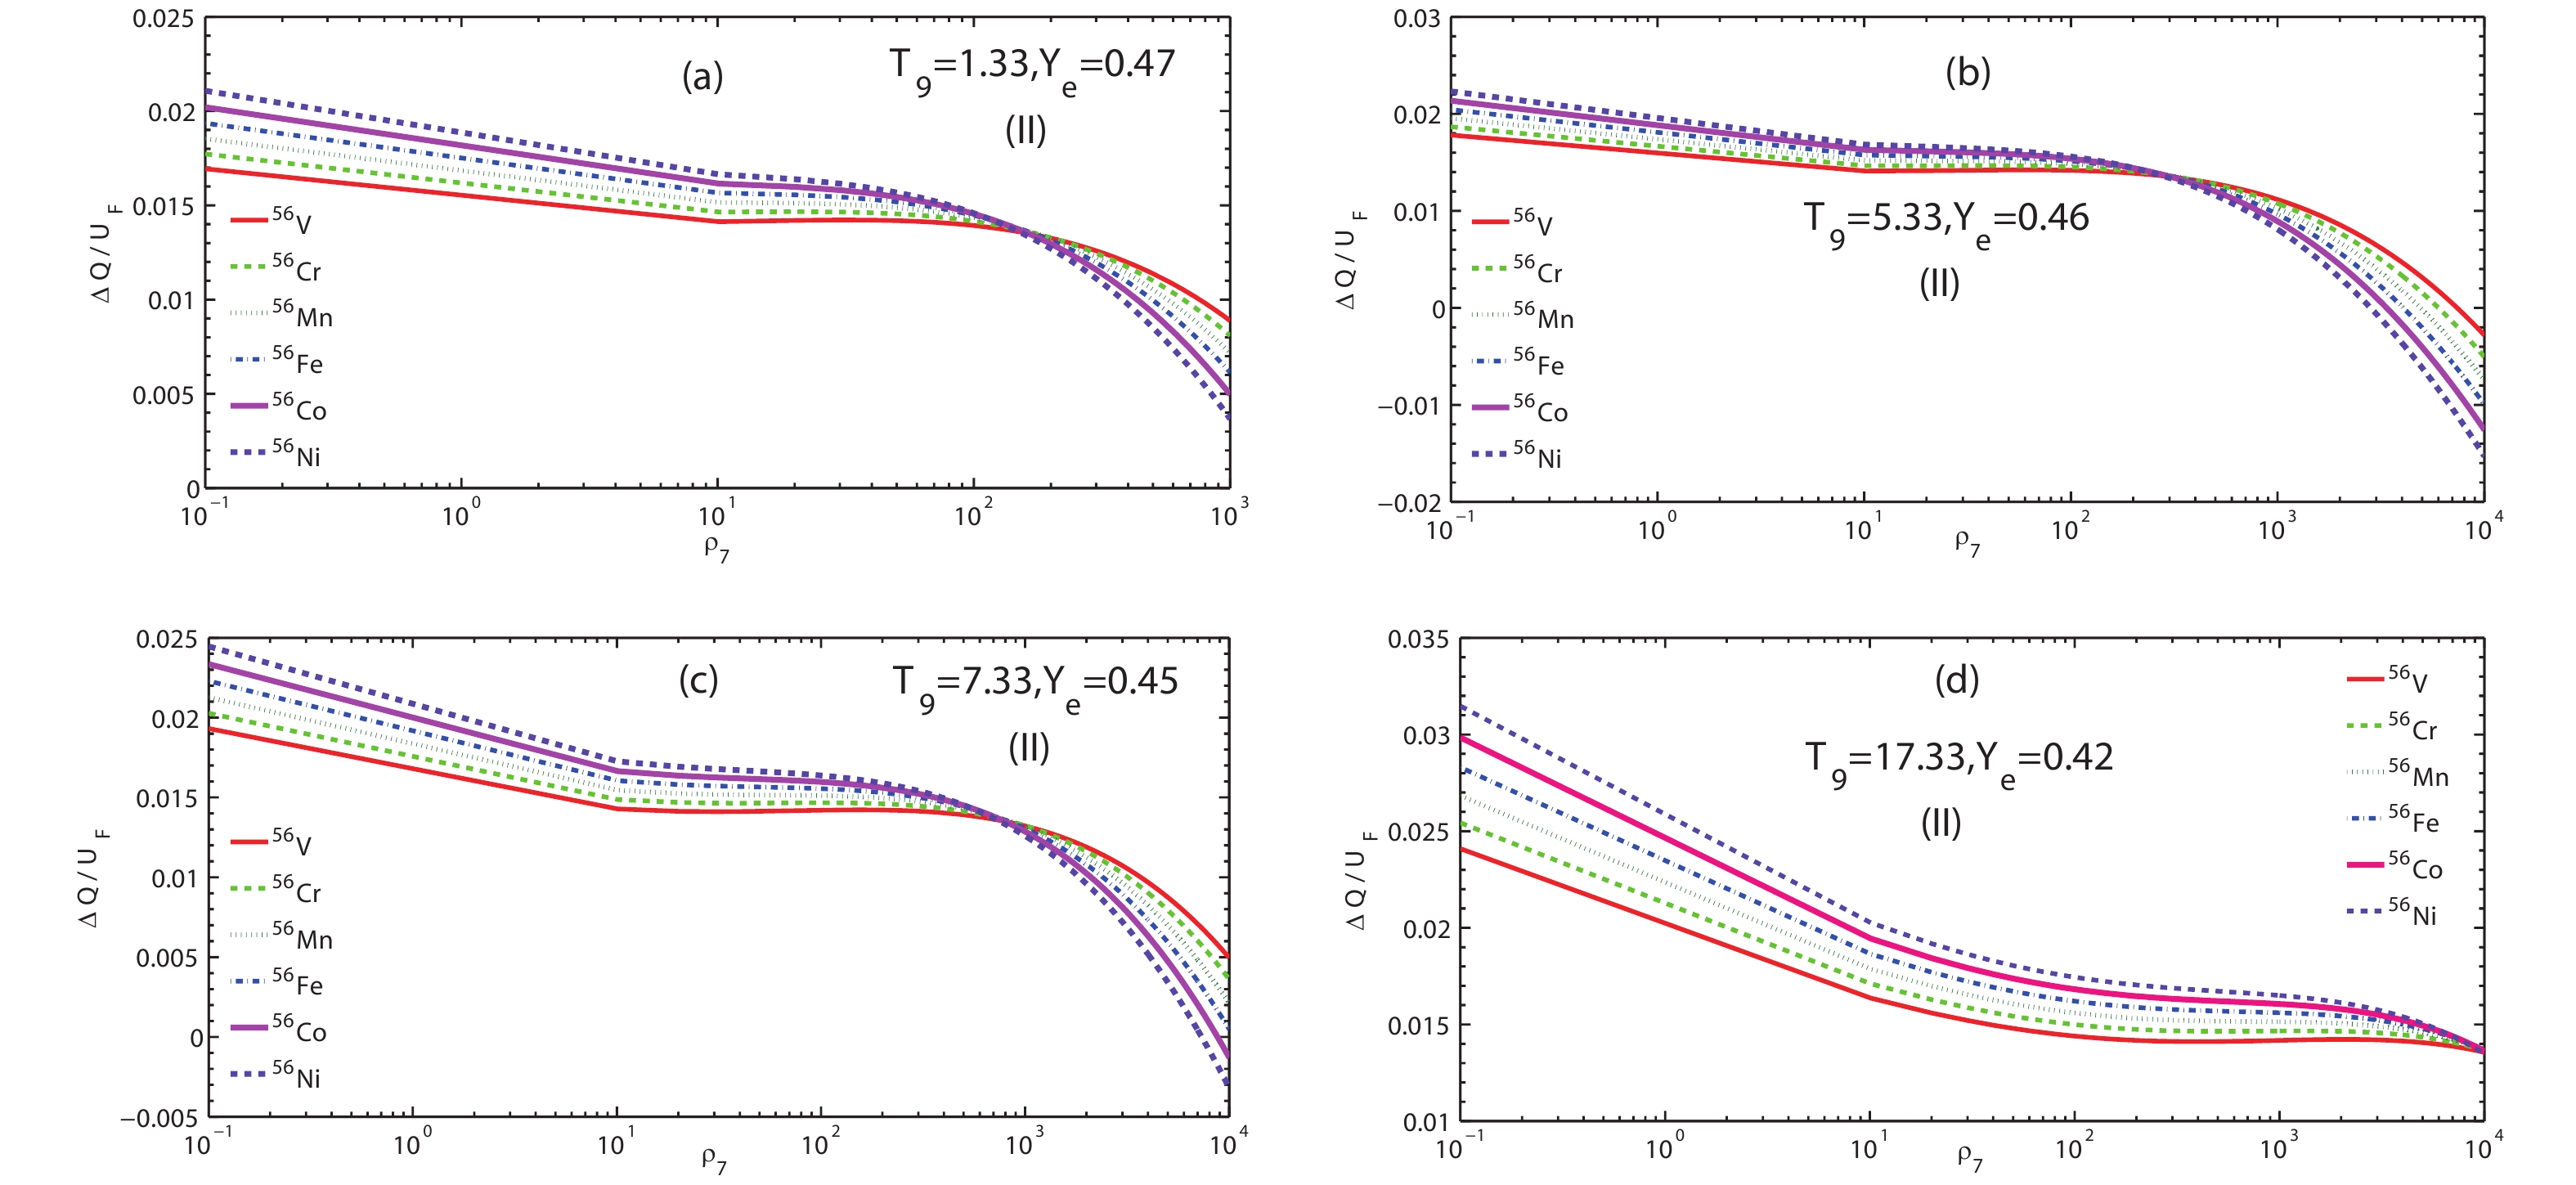
Figure 3. (color online)
△Q/UF ratio for the corrections of Q-value, and electron Fermi energy as a function of electron densityρ7 at several typical temperature points for model (II).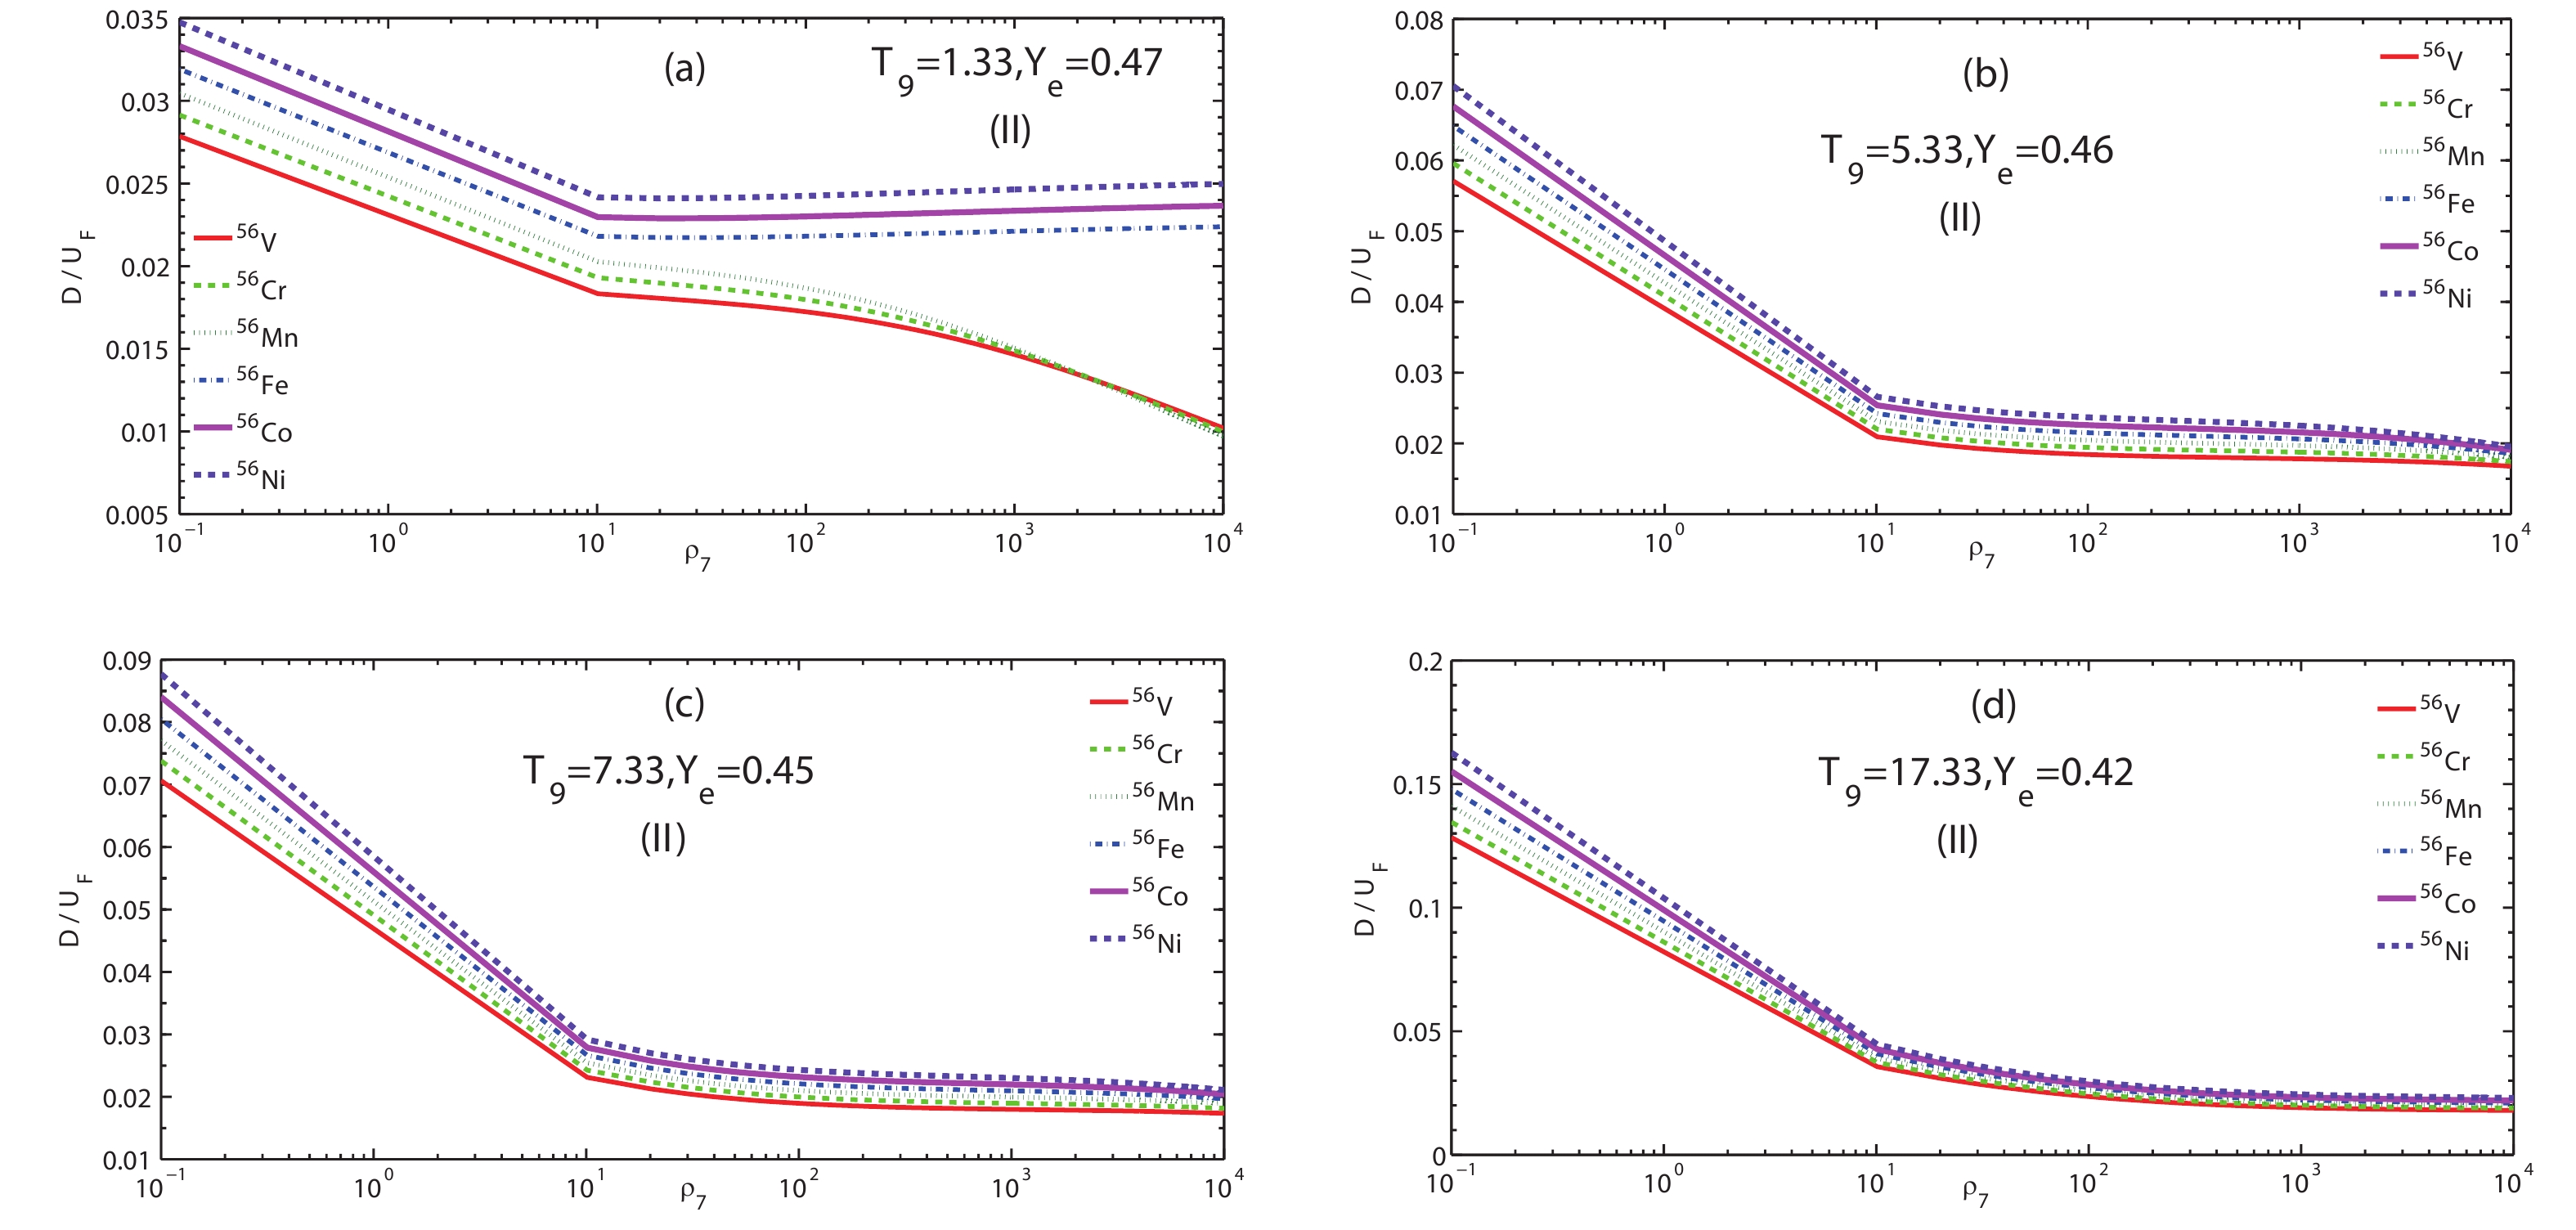
Figure 4. (color online)
D/UF ratio for the correction of screening potential, and electron Fermi energy as a function of electron densityρ7 at several typical temperature points for model (II).The screening factors
C as a function ofρ7 for the models (I) and (II) are shown in Figs. 5–8 at different densities and temperatures. The effect of the SES onC decreases as the temperature increases for a given density. For example, atρ7=103 for model (I), the maximumC for 56Ni decreases from 7.272 to 1.014, as shown in Fig. 5, and from 33.14 to 4.319 as shown in Fig. 8 for model (II).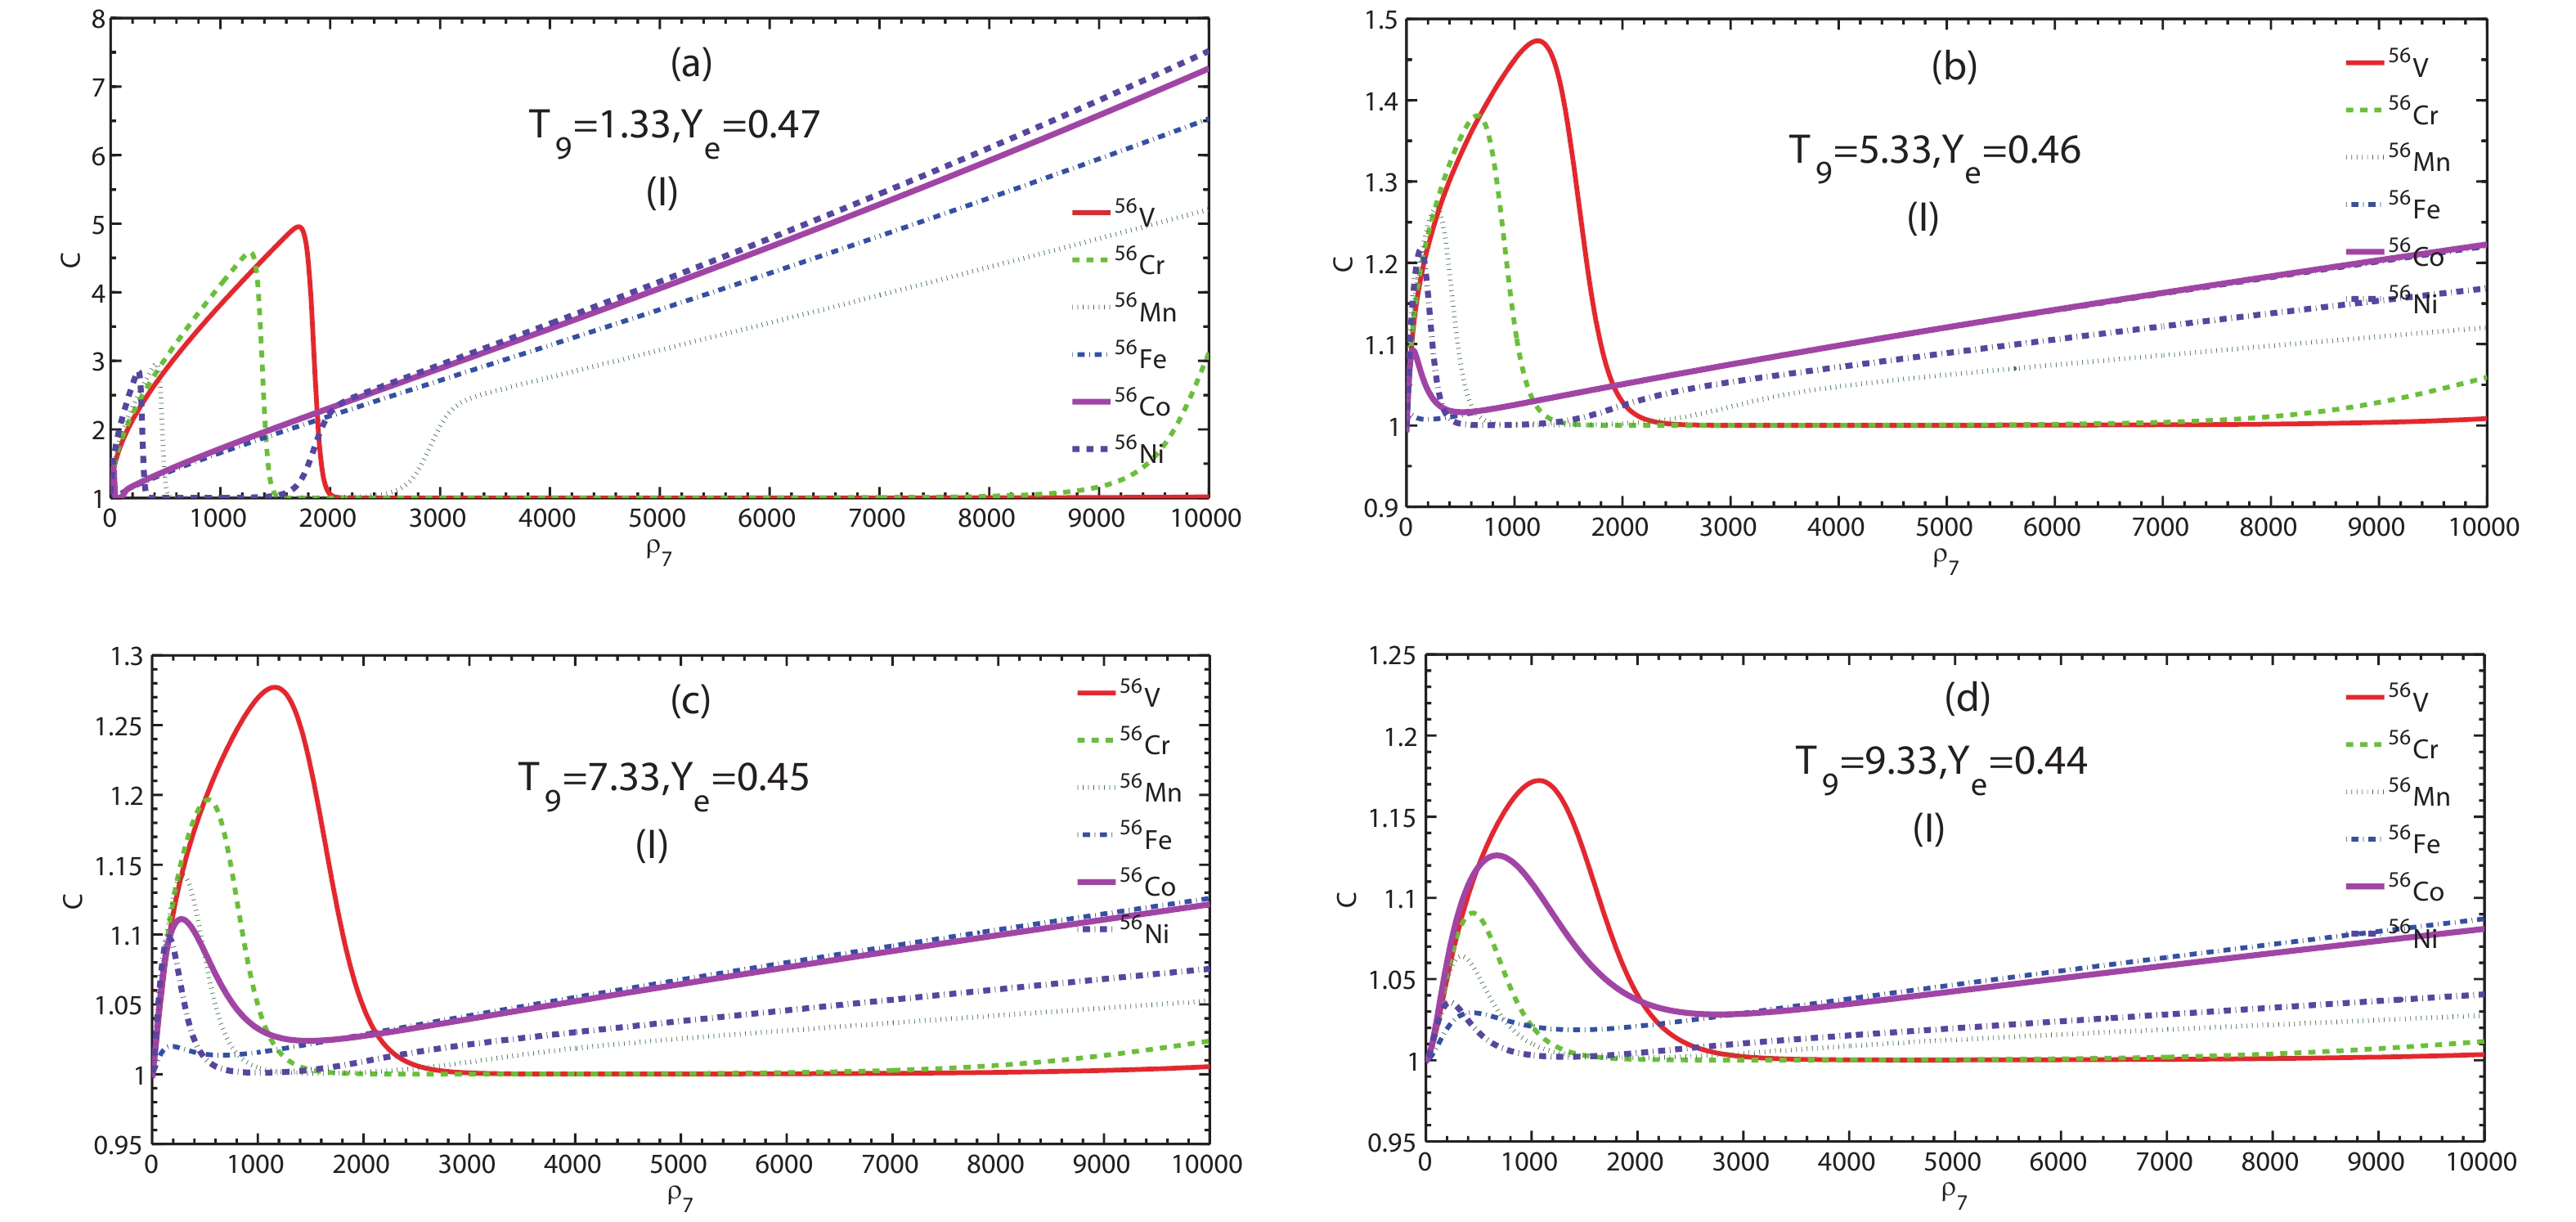
Figure 5. (color online) Screening enhancement factor C by beta decay of 56V, 56Cr, 56Mn, 56Fe, 56Co, and 56Ni as a function of electron density
ρ7 at relatively lower (T9=1.33,5.33 ) and medium temperatures (T9=7.33,9.33 ) for model (I).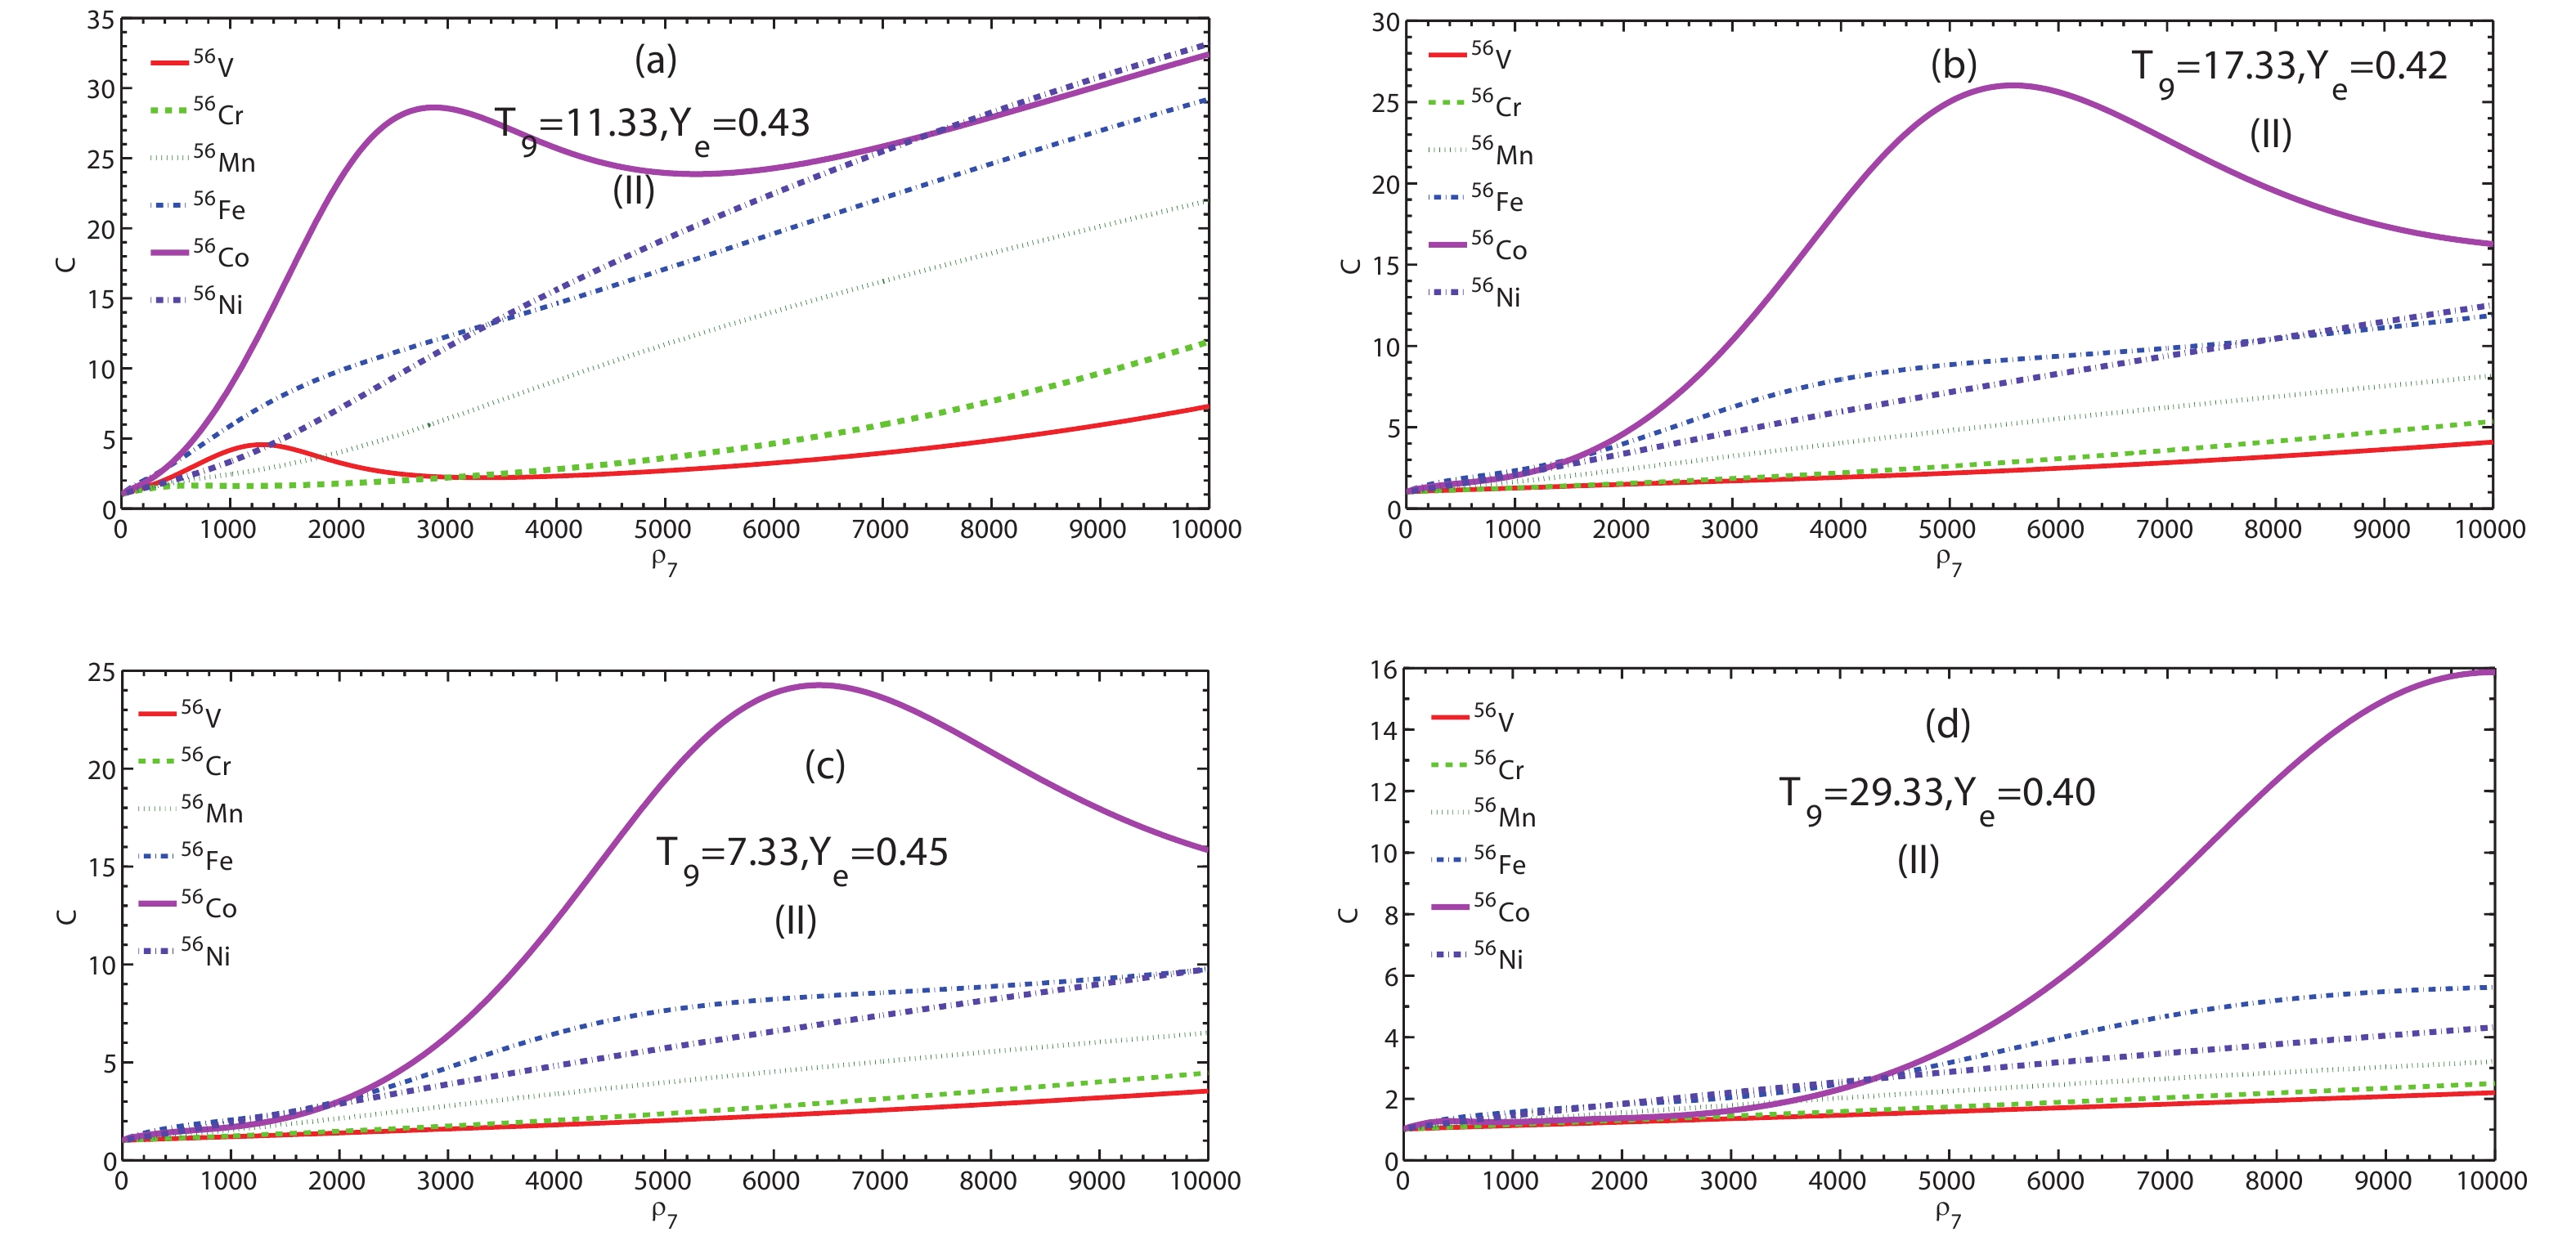
Figure 8. (color online) Screening enhancement factor C by beta decay of 56V, 56Cr, 56Mn, 56Fe, 56Co, and 56Ni as a function of electron density
ρ7 at relatively high temperature range (T9>11 ) for model (II).At relatively low (
T9=1.33,5.33 ) and moderate temperatures (T9=7.33,9.33 ), we compare the results of Figs. 5 and 6. Herein, the factorC in model (II) is significantly larger than that of model (I). For example,C for 56V has a value of 4.955 in model (I), whereas it has a value of 651.9 in model (II) atT9=1.33 . The same conclusions can be derived from Figs. 7 and 8 for higher temperatures. We compare the calculations for Figs. 5 and 6 with those of Figs. 7 and 8 for model (I) and (II). Finally we conclude that the lower the temperature, the smaller the electron kinetic energy becomes. Hence, the SES effect onC and AELR is large.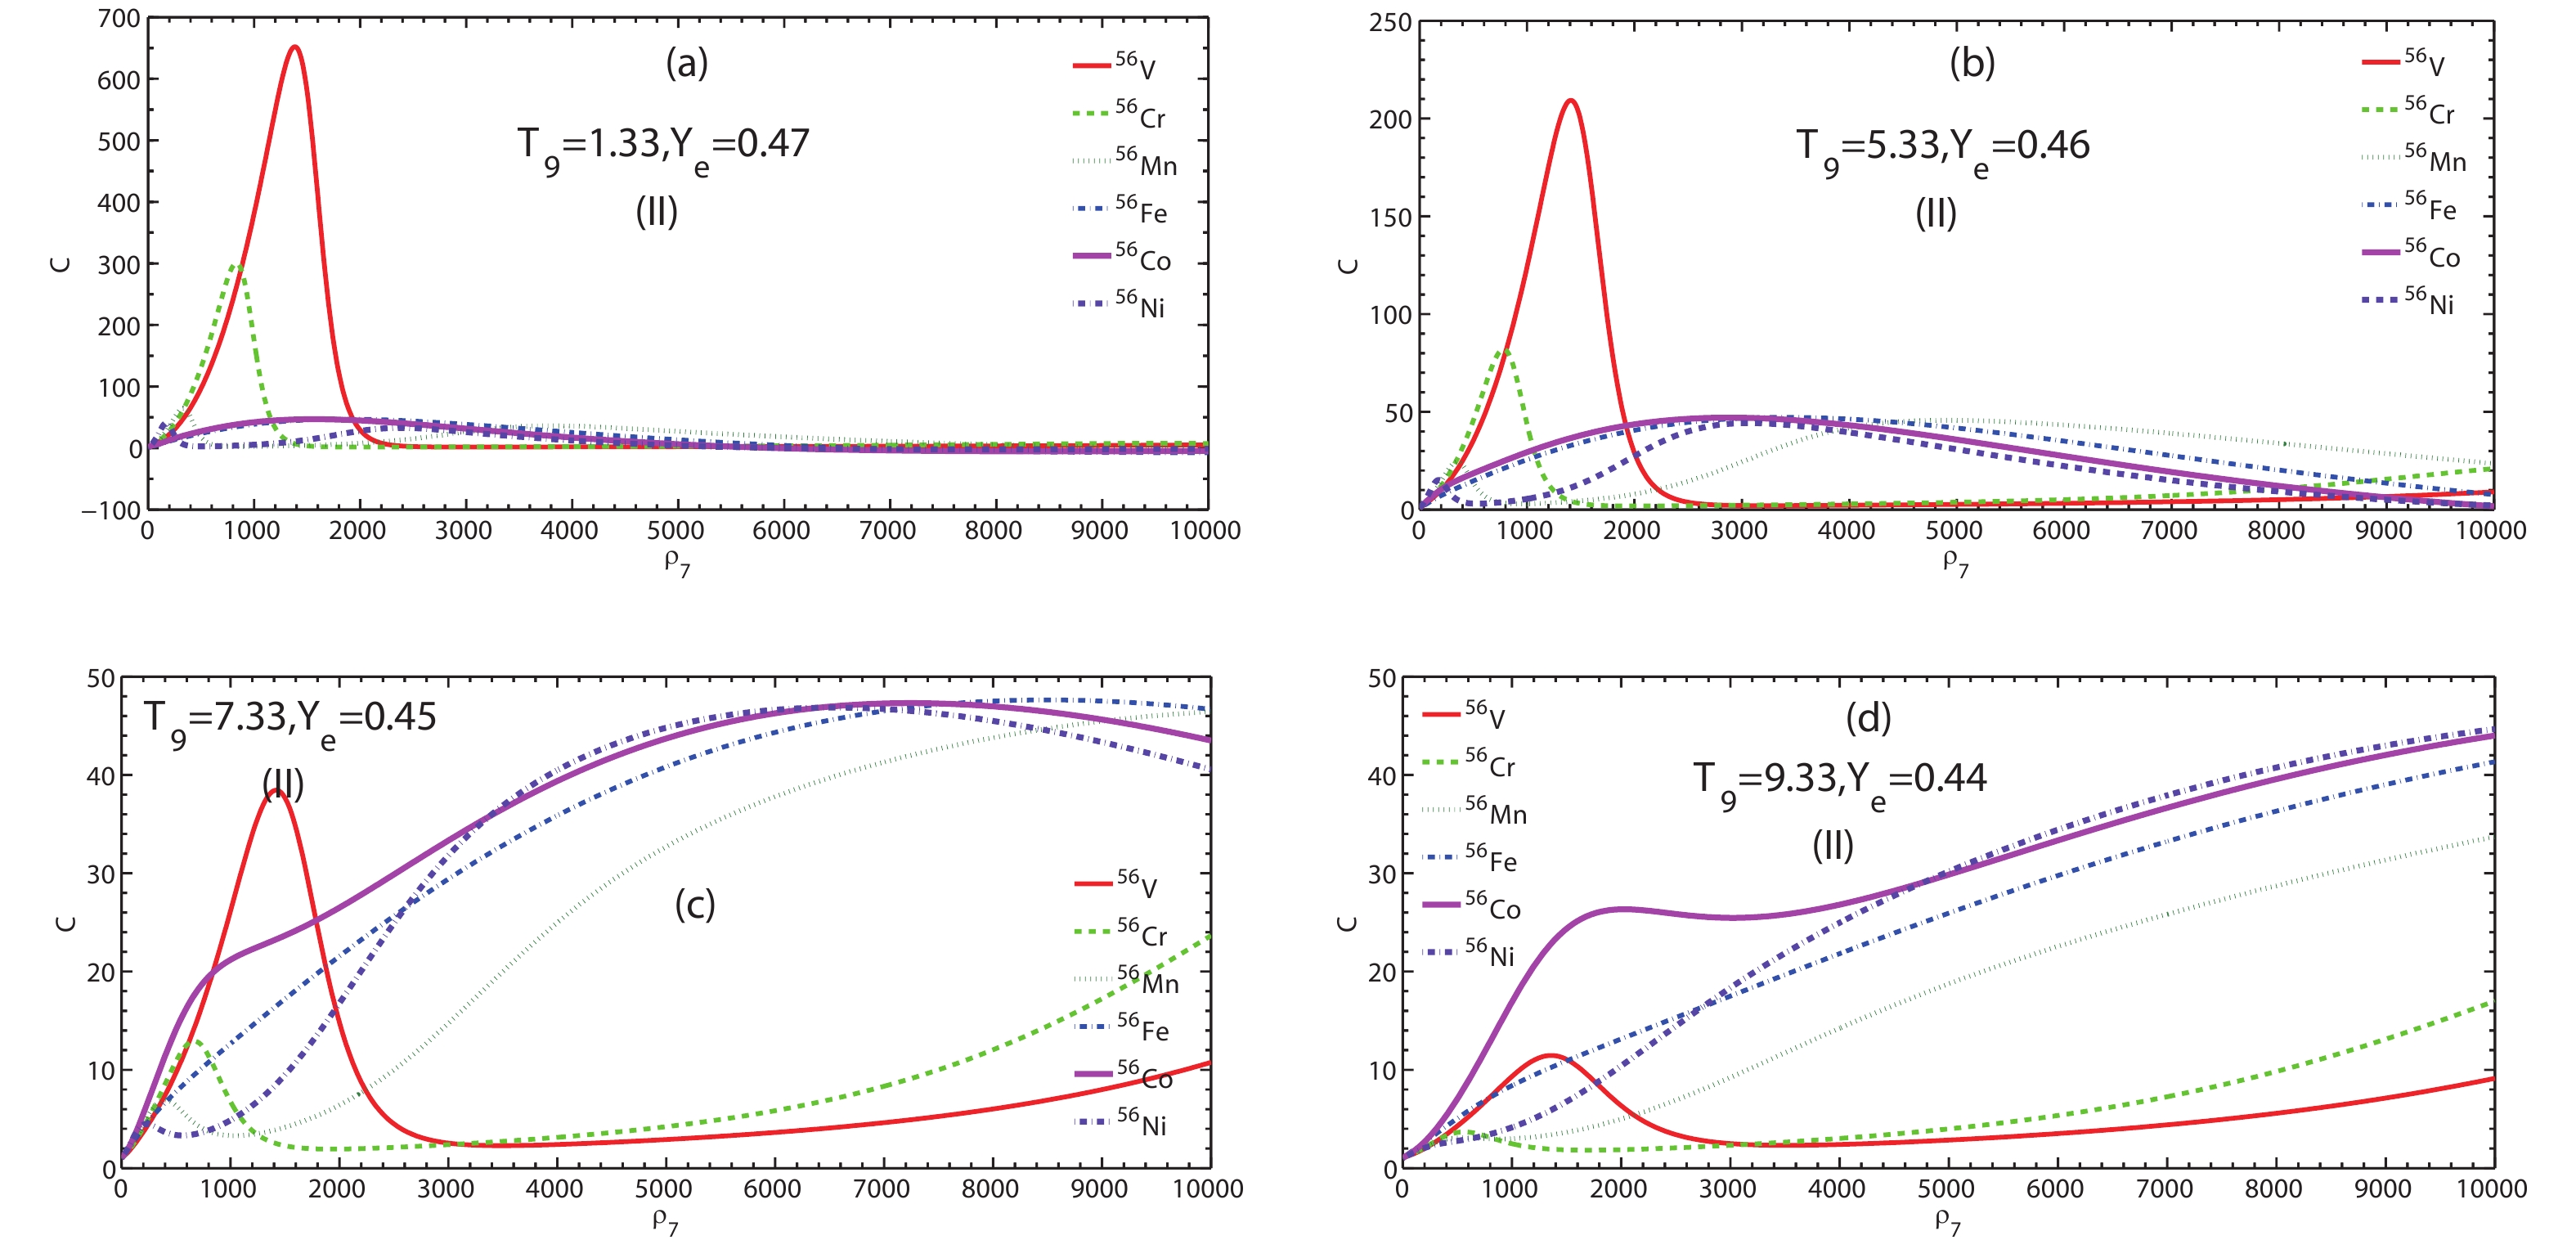
Figure 6. (color online) Screening enhancement factor C by beta decay of 56V, 56Cr, 56Mn, 56Fe, 56Co, and 56Ni as a function of electron density
ρ7 at relatively lower (T9=1.33,5.33 ) and medium temperatures (T9=7.33,9.33 ) for model (II).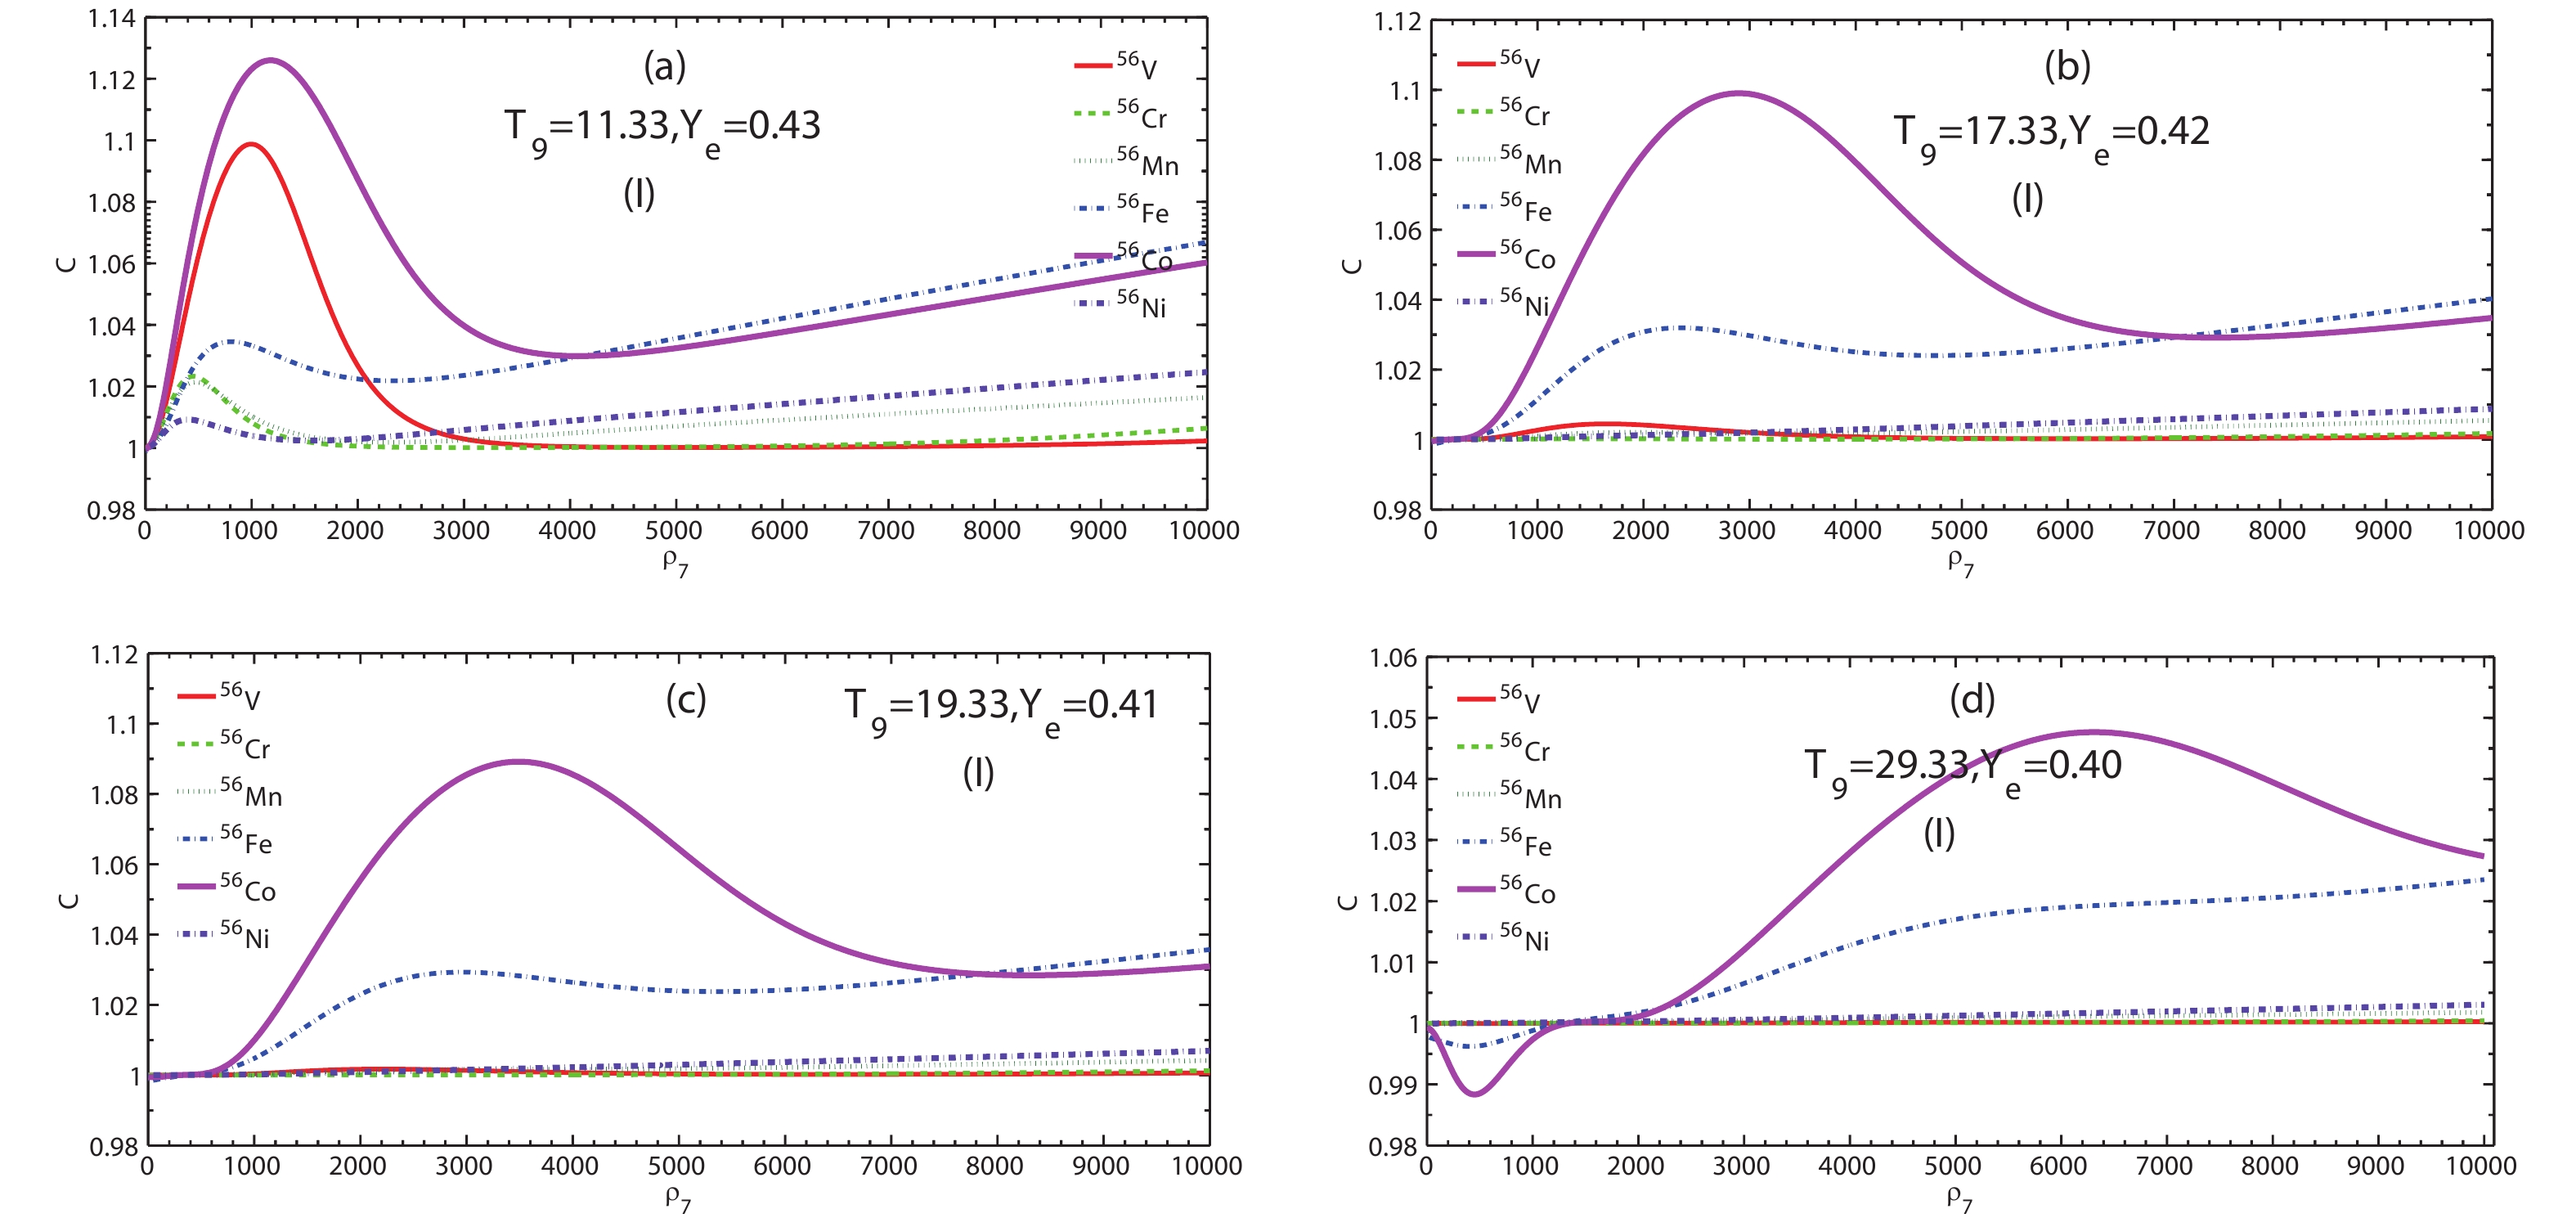
Figure 7. (color online) Screening enhancement factor C by beta decay of 56V, 56Cr, 56Mn, 56Fe, 56Co, and 56Ni as a function of electron density
ρ7 at relatively high temperature range (T9>11 ) for model (I).Judging from the influence of SES on nuclear physics and nuclear structure, the electron screening potential can significantly increase the energy of outgoing electrons during the beta decay process. In addition, the SES can also increase the energy of individual particles, whereas it relatively decreases the threshold needed for beta decay reactions because of the increase in the number of high-energy electrons. Indeed, the SES greatly accelerates the progress of beta decay.
Tables 1–4 show our results in terms of the screening enhancement factor
C . The AELR increases greatly due to SES from the information provided byC , especially for model (II). Tables 1 and 2 show the maximum value of the screening factor for 56V, 56Cr, 56Mn, 56Fe, 56Co, and 56Ni at several medium temperatures for model I and II. For example, atT9=5.33,Ye=0.46 the maximum value of enhancement factorC for 56V, 56Cr, 56Mn, 56Fe, 56Co, and 56Ni are 1.473, 1.381, 1.266, 1.222, 1.223, 1.213 for model (I), whereas they are 209.3, 81.98, 44.58, 43.12, 47.02, 44.26 for model (II), respectively.nuclei T9 = 1.33, Ye = 0.47 T9 = 5.33, Ye = 0.46 T9 = 7.33, Ye = 0.45 T9 = 9.33, Ye = 0.44 ρ7 C(max) ρ7 C(max) ρ7 C(max) ρ7 C(max) 56V 1712 4.955 1221 1.473 1161 1.277 1071 1.172 56Cr 1271 4.584 650.7 1.381 520.6 1.197 440.5 1.091 56Mn 10000 5.208 260.4 1.266 270.4 1.141 340.4 1.064 56Fe 10000 6.532 10000 1.222 10000 1.126 10000 1.087 56Co 10000 7.257 10000 1.223 10000 1.122 670.8 1.126 56Ni 10000 7.272 150.2 1.213 150.2 1.098 10000 1.041 Table 1. Maxima of strong screening enhancement factor C at several typical temperatures within the medium temperature range for model (I).
nuclei T9 = 1.33, Ye = 0.47 T9 = 5.33, Ye = 0.46 T9 = 7.33, Ye = 0.45 T9 = 9.33, Ye = 0.44 ρ7 C(max) ρ7 C(max) ρ7 C(max) ρ7 C(max) 56V 1391 651.9 1411 209.3 1422 38.45 1331 11.45 56Cr 810.9 298.2 780.9 81.98 10000 23.66 10000 17.00 56Mn 330.4 64.80 4455 44.58 10000 46.70 10000 33.67 56Fe 1772 46.38 3564 47.12 8509 47.63 10000 41.34 56Co 1452 46.74 2883 47.02 7277 47.31 10000 44.65 56Ni 1703 40.90 3093 44.26 6527 46.85 10000 44.66 Table 2. Maxima of strong screening enhancement factor C at several typical temperatures within the medium temperature range for model (II).
nuclei T9 = 11.33, Ye = 0.43 T9 = 17.33, Ye = 0.42 T9 = 19.33, Ye = 0.41 T9 = 29.33, Ye = 0.40 ρ7 C(max) ρ7 C(max) ρ7 C(max) ρ7 C(max) 56V 10000 7.286 10000 4.087 10000 3.523 10000 2.196 56Cr 10000 11.86 10000 5.343 10000 4.447 10000 2.492 56Mn 10000 21.91 10000 8.139 10000 6.501 10000 3.205 56Fe 10000 29.16 10000 11.86 10000 9.745 10000 5.622 56Co 2382 32.37 5526 26.01 6326 24.24 10000 15.86 56Ni 10000 33.14 10000 12.49 10000 9.746 10000 4.319 Table 4. Maxima of strong screening enhancement factor C at several typical temperatures in the relatively high temperature range for model (II).
The results of
C at relatively higher temperatures are presented in Tables 3 and 4. We find that there is small enhancement inC at the higher temperature. For example, the maximum value of the enhancement factorC is 1.099 (e.g., for 56V) in Table 3, whereas is 33.14 (e.g., for 56Ni) in Table 4. This is because the higher the temperature leads to a larger electron energy at a given density. The effect of the SES on beta decay may be weakened due to higher electron energy.nuclei T9 = 11.33, Ye = 0.43 T9 = 17.33, Ye = 0.42 T9 = 19.33, Ye = 0.41 T9 = 29.33, Ye = 0.40 ρ7 C(max) ρ7 C(max) ρ7 C(max) ρ7 C(max) 56V 991.1 1.099 1542 1.004 10000 1.001 10000 1.001 56Cr 410.5 1.024 10000 1.002 10000 1.002 10000 1.002 56Mn 460.6 1.021 10000 1.005 10000 1.004 10000 1.003 56Fe 10000 1.067 10000 1.040 10000 1.036 10000 1.023 56Co 1171 1.126 2833 1.099 3413 1.089 6486 1.047 56Ni 10000 1.025 10000 1.009 10000 1.007 10000 1.003 Table 3. Maxima of strong screening enhancement factor C at several typical temperatures in the relatively high temperature range for model (I).
To summarize the above analysis, the
C and AELR are both influenced greatly by the SES as the density increases, as seen in Figs. 5-8. This is because the SES has a strong influence on the Q-value of the beta decay. As the density increases,D/UF and△Q/UF decrease. However, they have little relation with mass density whenρ7>102 , as shown in Figs. 1–4. The AERL is also strongly dependent on the beta decay Q-value. The higher the energy of the outgoing electron, the larger the AERL becomes, in the case where the electron energy is higher than the threshold energy.For model (I), the SES significantly alters the Q-value, the electron energy, and the half-life for the beta decay. According to Eqs. (7) and (10), due to the Q-value correction, the comparative half-life increases with the increase the Q-value. Because of the interactions among the electrons in plasma, the nuclear binding energy decreases. The effective nuclear Q-value (
Qif ) varies at high density because of the effect of the charge dependence on the binding energy. Based on Eqs. (8) and (9), the beta decay increases due to the SES.For model (II), we discuss the influence of the SES on the enhancement factor and AERL by beta decay, by considering the corrections of the Q-value, electron energy, and the half-life, as well as the electron chemical potential. According to Eqs. (13–22, 25), the half-life and electron chemical potential increase due to the the Q-value correction in the SES. The nuclear binding energy also decreases due to interactions with the dense electron gas in the SES. Based on Eqs. (13–24), the beta decay increases greatly due to the SES. Comparison of the results of model (I) with those of model (II), as shown in Figs. 5-8, shows that an improved estimation of the SES for AERL is given in the model (II).
In contrast, the pairing effect and Q-values with the neutron number of the parent nuclei play key roles in the
β− decay reaction. For instance, the half-lives with Q-values are strongly influenced by them. As shown in Fig. 2 of Ref. [36], when the number of neutrons increases, the comparative half-live decreases, whereas the Q-value increases.The shell and pairing effects are very important in the nuclear structure. Some information on the pairing effects on
β− decay half-lives and Q-values is described by the parameterδ . When the number of nuclear neutrons increases, the beta decay reaction can be more active because of the pairing effect. Thus, the AERL increases.Because of the quantum effect, the shell effect strongly changes the nuclear structure and influences the
β− decay comparative half-lives. A complete correction of shell effects should include all major shell, as well as sub-shell closures. A reasonable approximation is given by Eq. (4), when we consider the shell effects and pairing effects.Based on Eqs. (7) and (10) for the model (I) (Eqs. (15–22) and Eq. (25) for the model (II)), the SES influences the Q-value and decay half-lives. From Figs. 1–4, we find that the enhancement factor
C rises and falls because of to the shell effects and the pairing effect in the SES, as well as the corrections of the Q-value. -
We investigate the influence of SES on the AELR by beta decay for several iron group nuclei, based on two different SES models. We calculate the screening potential based on IBSM and LRTM. We compare the effect of the SES from two screening models on AELR by considering the corrections of the Q-value, electron chemical potential, and the shell and pair effects. We find that the AELR by beta decay increases by two orders of magnitude, and the enhancement factor can reach 651.9 compared to the case without SES as the density increases in model (II). Meanwhile, this value is 7.272 in model (I) for a given temperature. As the temperature increases, the influence of SES on AELR is weakened. Comparing the results of model (I) with those of model (II), we find that the study of AERL in model (II) may represent an improved estimation.
The AELR by beta decay plays a key role in stellar cooling evolution. Our results may have important consequences for astrophysical applications, and in particular, for the burst mechanism of supernovae explosion and cooling numerical simulations.
Strongly screening β− decay antineutrino energy loss in presupernova
- Received Date: 2018-12-03
- Accepted Date: 2019-03-26
- Available Online: 2019-06-01
Abstract: In this study, we investigate the ion-ball screening model (model (I)), focused on the screening electrostatic potential per electron under the Wigner-Seitz approximation and the Q-value correction. By considering the changes of the Coulomb free energy and the effects of strong electron screening (SES) on the Q-value and the Coulomb chemical potential, we discuss the linear-response screening model (model (II)). We also analyze the influence of the SES on the


 DownLoad: